Grace Ambrossi, Laura Londoño, Mariana Suarez, and Nathan File
Introduction
California’s Green Dot is a non-profit organization centered in Downtown LA. This CMO was founded in 1999 in direct response to the poor state of the Los Angeles public schools. At the time, half of the students from the Los Angeles Unified School district did not graduate, while the half that did struggled in college. The schools from the LAUS district struggled with issues of overcrowding, which has lead to bigger classroom sizes. A decade later, the district continued to have very low high school completion rates with only 61.6 percent of students graduating in 2012. Overall, students in the Los angeles school district had been low performing academically. Because a third of the students were English Language Learners and the size of the classrooms kept growing, the lack of attention given to individual students and general overcrowding, the test results for the school were falling behind. Green Dot became the only school network in the country to lead the successful turnaround of a large high school (3,000+ students). This led the school to be featured as the leader of school turnarounds by the US Department of Education (Green Dot Website).
In August 2000, Green Dot opened its schools with just 140 students coming in to start freshman year of high school. Green Dot was able to achieve better student outcomes with the same student population and lower per pupil funding than the district or unionized schools could. Today, the schools have been able to grow in order to accommodate 11,000 additional students in multiple cities such as Memphis, TN and Tacoma, WA. While Green Dot does have significant issues within its schools in terms of who is allowed in and the environment for teachers and administrators, Green Dot has been an overall force for good in downtown Los Angeles education.
Methods
In an effort to better understand California’s Green Dot Schools, an online number generator was used in order to select six Green Dot Schools for thorough investigation. These schools were used as case studies through which to examine federal, state, and CMO data. Though it was harder to find data for some of the schools, specifically Animo Ellen Ochoa Middle School, data from all six schools and from multiple sources provided necessary information in order to study the mission and effects of Green Dot Schools.
History, Pedagogy, Mission
The GreenDot organization was founded by Steve Barr in 1999 and consists of 18 public schools. In 2006, Green Dot opened five charter schools in the area of Los Angeles that had the most struggling high schools. In 2008, a majority of permanent teachers at the schools in the area voted to reconstitute their underperforming schools as Green Dot Charter Schools. That same year, the Los Angeles Times wrote about concerns that the schools being operated by Green Dot during their regular school year and predicted that the attempt would fail. When school officials began to look further into the project, generally positive test scores and student performances were found. Though this is a promising find, it remains unclear whether this success was due to the fact that children went through a screening process that showed them to be good students prior to being admitted or whether these were children who would’ve done significantly worse at a different school. Today, there is a higher graduation rate from the high schools included in the Green Dot group than from those found in the Unified School District. Green Dot’s mission, in its own words is “to help transform public education so all students graduate prepared for college, leadership and life” (Mission, Green Dot Website).
School Demographics
California’s Green Dot Schools consist of mostly Hispanic and Black students, with several White students among other minorities. Hispanic students outnumber Black students at all but one of the charter schools (Alain Leroy Locke College Preparatory Academy). Green Dot Schools contain significantly more students of color than the rest of the Los Angeles Unified School District; in comparison to the rest of the Los Angeles Unified School District, Green Dot Schools contain eight percent more Hispanic students, and six percent more Black students proportionally.
Figure 1
Other demographic factors also show major differences between Green Dot Schools and their surrounding district. With regard to socioeconomic status, Green Dot Schools represent 18% more low-income students than the Los Angeles Unified School District at 94% of the school populations. They house approximately 5% fewer English Language Learners than LAUSD, and 2% fewer Special Education Students. The visuals below illustrate the diversity of Green Dot Schools in isolation of the rest of the LAUSD, in addition to a comparison between Green Dot Schools and the rest of the LAUSD with regard to these factors.
Figure 2
Student Achievement
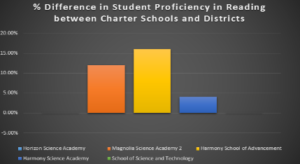
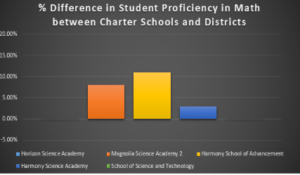
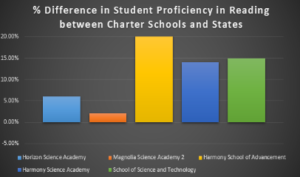
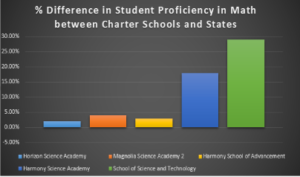
Green Dot Schools pride themselves in their academic performance. According to the Cowen institute, Green Dot schools “average more than 76 points higher on the California Academic Performance Index.” This means that Green Dot Schools are not only doing better than the rest of the Los Angeles Unified School District, but they are also considerably higher achieving than both district and charter schools in the rest of the state of California when analyzing overall performance in the state. Furthermore, Green Dot Schools sit among the highest performing schools in the country, placed in the top 2.5% of schools nationally according to the U.S. News and World Report list (Green Dot Public Schools). Green Dot Schools achieve higher test scores in both reading and math in comparison to the rest of the state of California as evidenced by Green Dot’s student achievement data (Civil Rights Data Collection).
Figure 3
School Discipline
According to collected data from the DOE OCR, Hispanic and Black students are most frequently the recipients of disciplinary reprimands including suspensions and arrests (Civil Rights Data Collection). These students also make up the majority of the student population in the schools, so the percentage of disciplined students under any one category is frequently negligible given that they belong to a large category.
Schools vary with regard of total disciplinary reprimands and the number of disciplinary reprimands as a percentage of the total student population. This indicates that factors outside of the schools’ discipline programs influence the behavior of students within any given school.
Green Dot Schools claim to have a “progressive discipline plan” in place at each of its schools (2016/2017 Green Dot Public Schools California Student Policy Manual). The progression of this plan consists of teacher detentions, followed by administrative detentions, suspensions, and finally expulsions. Green Dot Schools use a “Matrix for Suspension/Expulsion Recommendations,” categorizing offenses and the necessary actions to be taken by the school thereafter.
Marketing and Media
Green Dot Schools wants you to feel immediately that it is not like other charters. It dissociates itself with the broad ideas of charters from the jump, using “Green Dot Public Schools” in its website heading, and scarcely mentioning even the word “charter” throughout its site.
Figure 4It asserts its unique encouragement of teacher unionization, no admission requirements other than entering a lottery, and lower funding per pupil than nearby public school districts to further this distinction. In a 2015 LA Times piece on Green Dot, the CMO’s fingerprint covers the language, reading as a long-form advertisement. The writer emphasizes these distinctions between Green Dot and other charters, without mention of any real concerns or issues within the schools, which certainly exist. Brett Wyatt, a former teacher at a Green Dot school, described his and other staff’s experiences on Diane Ravitch’s blog. Wyatt mentions frequent teacher and administrator resignations due to “unsafe working conditions” because of violent students who weren’t sufficiently punished, as well as “limited future advancement” for staff because of broken evaluation and incentive systems.
Green Dot actively builds distance between itself and other charters to dispel the growing notion of charters as problematic, corporation-based institutions. Instead, it highlights a track record of turning around many underperforming schools, and touts praise from the Department of Education, and several news outlets. The CMO has invested significantly in the marketing of this preferred vision, with news stories as well as its own videos, which simultaneously broadcast inclusivity and exclusivity. None of Green Dot’s website or vimeo account is in Spanish, suggesting a continuation of the trend mentioned by Kevin G. Welner of charter schools that selectively market to English speakers only (Welner 2013). Starting up in Los Angeles and attempting to serve lower-performing schools, one must conclude this could not have been an honest oversight. Nor does Green Dot offer welcoming marketing material for special needs students. Indeed, our demographic data indicates fewer English Language Learner and special needs students attend Green Dot schools than other local schools.
Figure 5
At the same time, Green Dot almost exclusively uses Latino and African American students in its promotional imagery, attempting to advertise and attract diverse student body. They’ve accomplished this goal of racial diversity, enrolling more students of color than other local schools. This contradiction reflects a trend in charter schools to be very selective in how diverse and accepting they truly wish to be. It allows charters to potentially select a group of students that they know can be successful, and ignore students who may have difficulties. A school’s success rates can be inflated this way, filling a school with students who may have been successful no matter what kind of school they attended.
Accountability and Oversight
Green Dot schools are directly operated by the CMO. Instead of building its own schools, Green Dot’s model involves taking control of pre-existing schools, and implementing their own policies and practices. Green Dot makes this clear, marketing itself as leaders of school turnaround. There isn’t direct data available regarding how much annual funding goes from each school to the Green Dot CMO. While Green Dot does provide some lengthy financial statements on its website primarily focused on budgets and public funding, it is unclear what money goes back from the schools to the CMO. Green Dot has been clear of any financial scandal or obvious conflicts of interest.
Funding
The Green Dot California schools use both public and private funding to support their initiative of providing a high-quality education. In 2004, Green Dot received a $2.8 million grant from the Broad Foundation in order to “help build additional charter schools” but there was no data on whether this grant was successfully used for this purpose(Buchanan 2004). Additionally, the Green Dot Public Schools lost in its bid for a Race to the Top grant in 2012 of $30 million (Blume 2012). This came as a huge blow to the Green Dot schools as a whole since per-pupil funding for public charter schools in California has steadily declined since 2008 (Financials, Green Dot Website).
Staffing
Professional development is an integral part of Green Dot’s mission in order to ensure that teachers and administrators are learning and growing alongside their students. This system provides teachers with “curriculum specialists to improve practice,” “school leaders who spend the majority of their time on instruction, observation and coaching,” and professional networks with other Green Dot teachers in a series called “All Green Dot Days” (FAQ, Green Dot Website) Additionally, unlike most other charter school organizations in the United States, the Green Dot California school teachers and staff are organized under a union called Asociación de Maestros Unidos (AMU).
Relationship to District
Green Dot Public Schools were created in response to the dismal graduation rate and preparation of students at the Los Angeles Unified District high schools. Green Dot schools outperform its district schools in both their graduation rate and their number of students admitted to four-year universities. For example, in 2004, 80% of Green Dot students graduated on time whereas only 45.3% graduated from LAUSD high schools (The Gates Foundation). Because of its success and retention rate, Green Dot is considered “the leading Turnaround school operator” (Scholastic 2007). One of its most controversial transformations is of the Locke High School, which was one of the worst performing schools in the district. The controversy materialized from the “signatures of interest” that Green Dot had collected from Locke faculty members as part of their formal takeover plan for the school (Rubin 2007). The district rejected the plan claiming that many of the signatures themselves were invalid because faculty members were confused by the “proposed takeover”(Rubin 2007). District officials explained to faculty members that signing the petition “put their district employment at risk” and did not necessarily translate to a guaranteed position with Green Dot. Learning this, many of those who had initially signed the petition rescinded their signatures. Green Dot needed a majority of faculty members to be in agreement with their plan; therefore, they claimed that this was a tactic by the district to undermine their plans for Locke. Nevertheless, Locke was eventually taken over by Green Dot in 2008 (Rubin 2007). Now, students attending Locke “are 1.5x more likely to graduate” than students at other district schools (About, Green Dot Website). Ultimately, Green Dot schools are currently leading the district in serving its low-income and minority students.
Conclusion
The purpose of this thorough examination is to answer the question: Are Green Dot Schools an overall beneficial or detrimental force in their community? Unsurprisingly, as is with many CMO’s and charter schools, the answer is complex. It appears like the Green Dot public school initiative allowed students, especially minority students, better educational opportunities in a struggling downtown Los Angeles. The public school system that Green Dot sought to replace was poorly prepared students for life beyond middle and high schools. Their repeated ability to turn around these formally failing schools is undoubtedly impressive, now ranking amongst the best in LA, California and the US. Maybe this is in part because the schools are very selectively choosing which kinds of students get access to this education; are they the students who were much more likely to succeed no matter where they went? Signs point to yes, with fewer english language learners and special needs students. Additionally, there are questions as to whether or not Green Dot Produces a positive environment for its teachers.
However, despite these issues Green Dot has objectively enlarged and enriched education opportunities for children in downtown Los Angeles. There is no perfect school, and hopefully as Green Dot continues its mission across the country, it can widen its enrolled student pool, and become a more attractive place for teachers.
References
“2016/2017 Green Dot Public Schools California Student Policy Manual.” (2016)
“About Us.” Green Dot Public Schools.
Blume, Howard. “Southland schools come up empty in contest for federal grants.” LA Times (December 11, 2012)
Blume, Howard. “Green Dot, based in LA, plans to open schools in other states”, LA Times (July 1st 2014)
Buchanan, Joy. “$2.8 Million Donated for Charter Schools.” LA Times (March 16, 2004)
“Civil Rights Data Collection.” Civil Rights Data Collection.
“FAQs.” Green Dot Public Schools.
“Financials.” Green Dot Public Schools
“Green Dot to Open 10 New College-Prep High Schools in Watts”, The Gates Foundation.
Rubin, Joel. “District blunts Locke High’s revolt.” LA Times (June 2, 2007).
“The Rise of Green Dot Schools.” Scholastic (June 2008).
Welner, Kevin G “The Dirty Dozen: How Charter Schools Influence Student Enrollment.” Teachers College Record (2013)
Wyatt, Brett. “The Inside Story of a Green Dot Charter School.” dianeravtich.net (June 5th 2013)
Evelyn Torres Abundis, Amanda Crego-Emley, Otis Baker, Jorge Lema
Ed. Studies 245
Charter Management Organization Report:
Knowledge Is Power Program
1. Introduction
The Knowledge Is Power Program (KIPP) charter management organization is committed to providing a rigorous college-preparatory education to students from underserved communities.[1] By setting high expectations, communicating clearly with families about their children’s potential, and endorsing a no-excuses model, KIPP seeks to close the gap between the “haves” and the “have-nots”, ensuring that low-income and minority students have access to education. The documentary “Waiting for Superman” depicts KIPP schools as the silver bullet for education reform, emphasizing the positive results they have with poor, minority students.[2] Though KIPP’s model has been lauded by many for producing better educational outcomes and test scores than district schools,[3] others have critiqued the organization for its strict discipline, high rates of teacher burnout, and high levels of student attrition. As these critiques reveal, KIPP’s model is far from perfect, however it is important to note that, while many charter schools have come under fire for selection bias, KIPP’s student enrollment matches up with its mission–it really is focusing on low-income communities of color.
1. History, Pedagogy, and Mission
KIPP began in Houston, TX in 1994. Two alums of Teach For America, Dave Levin and Mike Feinberg, initiated a pilot program with a group of Texas fifth graders centered around five guiding precepts: “high expectations, choice and commitment, more time, power to lead, and a focus on results.”[4] From the fifth grade program, KIPP expanded into a network of middle schools covering the fifth to eighth grade before growing to include elementary and high schools.[5] According to their mission statement, KIPP schools pledge to help “students from educationally underserved communities develop the knowledge skills, character, and habits needed to succeed in college and the competitive world beyond.”[6] College readiness is integral to KIPP’s mission, and much of the program is structured around ensuring students have the support and skills necessary to go on to university.
Convinced that lack of time, low expectations, and institutional bureaucracy are the primary barriers keeping underserved populations from succeeding, KIPP schools embrace a “no-excuses” philosophy, meaning that students are held to rigorous standards regardless of background and circumstance and discipline is strict. KIPP mandates a longer school day; increased instructional time in the classroom–including Saturday school; and has students, families, and faculty sign a “Commitment to Excellence” pledge, outlining the roles and responsibilities of each member of the KIPP community to ensuring a successful learning environment.[7] Although KIPP schools do not offer a unified curriculum or standardized pedagogical style, they are bound by a shared mission and guiding philosophy.[8] Today, KIPP’s charter school network is the largest in the country, including 200 schools and serving 80,000 students nationwide.[9]
1. Methods
For the purpose of this study, a random selection of six schools was used as a sample for KIPP charter schools from KIPP Bay Area Schools and KIPP NYC Public Charter Schools: KIPP Bayview Academy (San Francisco, CA), KIPP Bridge Charter School (Oakland, CA), KIPP Heartwood Academy (San Jose, CA), KIPP Academy Charter School (Bronx, NY), KIPP NYC Washington Heights Charter (New York, NY), and KIPP Star Harlem College Prep Elementary School (New York, NY). These schools were compared with their surrounding districts in school demographics, student achievement, and student discipline. Data was collected from the National Center for Education Statistics for school and district level data on race/ethnicity and free and reduced lunch status.[10] Disciplinary data was collected from The Office of Civil Rights Data Collection.[11]
1. School Demographics
KIPP schools promote themselves as “open to all students, including those with disabilities.”[12] However, KIPP’s mission is to help “students from educationally underserved communities.”[13] Underserved communities are traditionally understood as minorities and low-income students.[14] Based on 2014-2015 data, the majority of KIPP students are of color and receive free or reduced lunch. These schools enroll more students of color than their surrounding districts.[15] For KIPP Bayview, there was an 11% difference in enrollment of students of color, increasing the racial segregation up from 87% students of color in the district. Moreover, KIPP schools have a higher concentration of students with free or reduced lunch.[16] With the exception of one, KIPP schools had at least a 5% increase of students with free or reduced lunch. Overall, the data supports KIPP’s mission to work in underserved communities, though it should be noted that this has increased segregation within KIPP schools.
Chart 1. Differences in enrollment of students of color in KIPP CMO charters and its surrounding districts.
Chart 2. Differences in free or reduced lunch status in KIPP CMO charters and its surrounding districts.
1. Student Achievement
Student achievement at KIPP schools is a big selling point. In his comprehensive of the performance of many KIPP schools, Jeffrey R. Henig, of Teachers College at Columbia, analyzed previous regional studies of KIPP schools including ones on New York City and the Bay Area. He concluded that KIPP students often perform better than students in traditional public schools and that students’ gains do not come from a more selective admission process or competitive advantage. In fact, students at KIPP schools were often previously low-achieving students who excelled in a different school environment.[17]
Henig cited an SRI study published in 2008 about the performance in KIPP Bay Area schools including both Bridge and Bayview. In the SRI study, researchers found that KIPP students in the Bay Area perform better across the board on standardized testing compared with state and national averages.[18] While academic gains achieved by students in KIPP schools were mostly positive, the study found that these KIPP schools had unusually high attrition rates. In especially bad cases, classes decreased by nearly 50% by the 8th grade.[19] This SRI study and Henig arrived at basically the same conclusion. Ultimately, KIPP students do achieve at significantly higher rates, but the rates of attrition are also “not insignificant.”[20] KIPP schools have been able to report high rates achievement that are apparent in almost every study, but the way that they burn out both students and teachers should be cause for concern. High attrition rates may stem from the fact that students at KIPP schools are more likely to be suspended, which may encourage families to move their children to schools where they are not as heavily disciplined or punished. A high attrition rate also suggests that the KIPP model of education is not universal. It only works for the select students that stay with KIPP.
1. School Discipline
KIPP schools are known for their adherence to the no-excuses model. The no-excuses model features extended school days, high expectations for student conduct, dress, and classroom engagement, and a structured disciplinary system.[21] KIPP focuses on the development of character for the success of its students, claiming that their expectations creates a culture of achievement.[22] Their “Commitment to Excellence” previewed on their website shows the pledges students must take to be part of the KIPP network; failure to adhere to them can lead to a student’s return to their local neighborhood school.[23] Although once recognized as a “possible solution to closing the achievement gap,” the no-excuses model is now highly criticized for its effect on students’ social and emotional learning.[24]
KIPP continues to strive for learning environments with “minimal distractions” while incorporating new systems of discipline such as restorative justice.[25] They attempt to sell themselves as a “safe, structured, nurturing environment.”[26] KIPP now embraces the development of character strengths including self-control, social intelligence, zest, and grit to achieve its success.[27] This is an attempt to disassociate with the no-excuses model. However, a look at disciplinary data from KIPP schools compared to its surrounding district shows a higher percentage of KIPP students receiving one or more in-school suspensions in most schools.[28] On average, there have been more suspensions at KIPP schools than the surrounding district schools. This means that KIPP believes it is faster to punish students for unacceptable behavior and does it more often. Here, KIPP students are also disciplined in ways that their peers at district schools are not because they are more likely to attend college and achieve academically at KIPP schools and lose these opportunities if they are suspended, expelled, or “encouraged” to leave a KIPP and attend a district school.
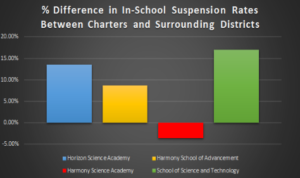
Chart 3. Differences in in-school suspensions in KIPP CMO Charters and its surrounding districts.
1. Marketing and Media
KIPP Promotional Video – emphasizes KIPP mission and shares perspectives of students.
KIPP markets itself as an organization that offers students of all backgrounds an opportunity to succeed. KIPP emphasizes high expectations, focus on character, highly effective teachers and leaders, and safe, structured, and nurturing environments.[29] On its website’s homepage, KIPP presents a slideshow with young students collaborating or hugging teachers and high school graduates celebrating their success, showing off their college pennants.[30] KIPP curates its web presence to showcase schools that foster community development and goal-setting for driven students.
On its website, KIPP not only emphasizes the support it provides students during their K-12 years, but also in college. Everything KIPP does, it claims, prepares students for college. A rigorous curriculum and instruction to develop student character by building zest, grit, optimism, self-control, gratitude, social intelligence, and curiosity.[31] Students experience “minimal distractions [with] more time for both academics and extracurricular activities,”[32]preparing them for college and enrolling them in “KIPP Through College,” which offers students support as undergraduates. By emphasizing the importance of college, creating a school system that revolves around it, KIPP discourages families for whom college is not the sole outcome of a quality education from sending their children to KIPP schools.
KIPP has been praised in the media for wanting all public school students to access resources that enable their success. In one article, KIPP CEO, Richard Barth, argued against the defunding of district schools in favor of charter school expansion because he believed that this would not fix the problems with the system.[33] Another article emphasized KIPP’s responsiveness to to a study that revealed that KIPP high school graduates struggle in college because many are financially challenged, some having to forgo meals to cover college expenses.[34] KIPP responded by cementing partnerships with universities to offer these students extra support.[35] As a result, KIPP is is viewed positively for its devotion to grander public education reform that surpasses its work within K-12 schools.
Elements of KIPP’s mission as stated on the KIPP website
However, KIPP’s teaching style and mission have been critiqued. Specifically, the notion that schools can develop characteristics, such as grit, in students is contested. Critics argue that character-based education is immoral, asserting that it contradicts the purpose of education by focusing it too narrowly on college attendance.[36] In addition, a 2015 NY Times article argued that “the increasing focus on qualities like grit will distract policymakers from problems with schools.”[37] It questions the impact a focus on character development will have on the perception of students and public school reform. Together, these news stories question the realities of the KIPP method in contrast to the promises and lofty goals that its website offers.
1. Accountability and Oversight
The KIPP Foundation is a nonprofit organization and is very transparent about its allocation of funds. Easily accessible on the KIPP website is a page entitled “Are We Building a Sustainable Financial Model?” that links to KIPP Foundation financial forms and a single audit report. In the 2014-2015 year, the KIPP Foundation allocated $39,157,949 to program services, which include leadership and development, research, network growth, teaching and learning labs, and the KIPP through college support program for KIPP alums; $9,659,292 to support services, including administration and fundraising; and $23,479,474 in grants to schools within their charter network.[38] A breakdown of funding allocation by individual school is not available, but KIPP does make a concerted effort to make its finances available to the public to ensure transparency and accountability.
With regards to accountability for educational outcomes, KIPP schools release their test scores, thereby making it possible to compare their performance to neighboring district schools. At the organizational level, many KIPP regional networks have a “Managing Director of Schools” who is tasked with overseeing all the school leaders in a district, providing support and professional development.[39] Moreover, KIPP schools release annual local control and accountability plans as well as accountability reports.
1. Funding
Although local and state per-pupil funding, with some federal help, covers the majority of KIPP’s costs, KIPP regions raise additional funds from local donors and foundations.[40] Over its lifetime, KIPP has received more than $60,000,000 from three groups alone – the Doris and Donald Fisher Fund, the U.S. Department of Education, and The Walton Family Foundation alone.[41] Between July 1, 2015 and June 30, 2016, over 70 foundations and individuals donated at least $5000.[42] Three foundation alone, the Doris and Donald Fisher Fund, Arthur Rock and Toni Rembe,and Walton Family Foundations, donated over $5,000,000 each.[43]
Most top donors focus on funding organizations that better education or aid people from historically marginalized communities. The Watson Foundation, for example, “expands the vision and develops the potential of promising students [challenging them] to create their own paths.”[44] Similarly, the Doris and Donald Fisher Fund “focuses on K-12 education reform, especially for underserved children, . . . looking for effective models that could be copied and scaled to reach a large number of students.”[45] In addition, Arthur Rock and Toni Rembe funds other organizations with missions similar to KIPP’s. It is a top level donor to Teach for America and has donated to Breakthrough Collaborative, which ‘“puts low-income middle school students on the path to college and inspires high school and college students to become educators.’”[46] Because so many groups donate to KIPP, it can be assumed that many interests are vested in the CMO. It is difficult to calculate the interest of every donor because of how many there are. The largest donors, however, have an explicit interest in educational outcomes and the success of students. As a result, they will hold KIPP accountable to the promises it makes, especially with a donor like the Atlantic Philanthropies who gave the last of its grant money, an amount not specified but between $10,000,000 and $25,000,000 in 2016 to KIPP.[47]
1. Staffing
On its website, KIPP stresses its effort to hire teachers who are “incredibly talented and passionate [to] teach eager minds.”[48] They share a fundamental “belief to do whatever it takes to help each and every student develop the character and academic skills necessary for them to lead self-sufficient, successful, and happy lives.”[49] They include teachers who have worked in schools serving educationally underserved students before, new teachers, and recent career changers.[50] KIPP schools comply with any applicable state and federal laws, and while certification requirements for charter school teachers vary by state, a quarter of teachers have graduate degrees or higher and a fifth are Teach For America alumni.[51] In addition, KIPP is “committed to attracting and developing individuals who share the life experiences of [its] students.”[52] More “than 40 percent of [its] teachers are African American or Latino.”[53] Nonetheless, KIPP ensures that no matter the background of its teachers, every student will be served in a way that enables their success.
Although the KIPP website emphasizes that its teachers are supported, there is teacher turnover and burnout. On its website, KIPP declares that teachers always have “room to learn, grow and and improve . . . through job-embedded coaching, school and region-wide professional development, and national leadership training.”[54] It believes that “the best way to develop leaders [in education] is 70% on-the-job learning, supported by 20% coaching, feedback, and mentoring, and 10% formal training.”[55] A Seattle Education blog, however, quotes a former KIPP teacher who declares that teachers at her school had “nervous breakdowns from extreme pressure and harassment of administration [with a] 50% turnover for staff each year.”[56] There is a dichotomy between what the KIPP website markets for students and the experiences of teachers to achieve this.
A high turnover rate coupled with the low weight placed on formal teacher training suggests that on-the-job training does not prepare KIPP teachers for their work and encourage them to remain in the long term. This is probably a result of the no-excuses model and pressure for teachers to ensure that all students succeed. It may also be difficult for a teacher to adopt to KIPP culture as was the case in Houston, when KIPP schools lost teachers because they did not have day care centers for children of teachers who worked extended school hours. School communities and support systems are not strong when teachers constantly come and go. This affects student achievement and attrition because students are less inclined to remain at a challenging school when there is not a strong community of teachers to support them, ones that have worked at the schools for a long time.
1. Relationship to the District
The 2001 report by the Department of Education on the impact of charter schools on their surrounding districts identifies important ways in which charter schools, more specifically KIPP schools, bring change. The first involves budgets. About 45% of administrators in the study said their budget decreased with the influx of charters while roughly the same amount said they found no change. Charter schools also cause operational changes within the existing district. The study found that when charter schools were added in districts, busing services run faster and many schools improved learning conditions. These improvements arose because overcrowding decreased and districts schools began to compete with charter schools. Districts schools often opened new programs in response to charter schools. The teacher pool, however, also decreased.[57]
The majority of major studies have shown that NYC and Bay Area KIPP schools, as well as charter schools as a whole, are beneficial because they serve urban populations with high concentrations of ELL students. A Stanford study showed that charters in these areas much better served these populations than traditional schools.[58] Specifically, ELL students are better served at KIPP schools because of their extended school days, extra services (such as tutors), additional time spent with ELL students, and the CMO’s focus on serving underserved students in poverty, many of whom are ELL students. These schools positively impact their districts because, often, they are better prepared to provide a tailored education program. However, we found little evidence of collaboration between KIPP schools and the rest of the district. There was sparse information on major budget changes or teacher shortages. The KIPP education method, while heavily focusing on students, unsurprisingly limits communication with the surrounding district on educational innovation. Overall, NYC and Bay Area have a net positive impact on their districts without directly collaborating with them.
1. Conclusion
KIPP has succeeded in very important ways, but is still flawed. It helps more low-income students of color succeed academically and attend college. Nonetheless, its methods have been challenged. This results from the fact that KIPP schools are so different from public district schools in their method of instruction and experiences offered to teachers. Despite this, KIPP’s success is not only evident in statistics, but in the number and size of donations it receives every year. It will be interesting to observe this CMO as it continues to grow, especially in terms of the voice it assumes in public education reform and not only college-access, but college success for KIPP graduates.
________________
Bibliography
Ericson, John, and Debra Smith with Paul Berman, Beryl Nelson, and Debra Soloman. Challenge and Opportunity: The Impact of Charter Schools on School Districts. Jessup, MD: RPP International, 2001. Accessed March 31, 2017. https://www2.ed.gov/rschstat/eval/choice/district_impact.pdf.
Golann, Joanne W. “The Paradox of Success at a No-Excuses School.” Sociology of Education 20 (10): 1-17.
Henig, Jeffrey R. What Do We Know About the Outcomes of KIPP Schools? New York: National Education Policy Center, 2008. Accessed March 31, 2017. http://nepc.colorado.edu/publication/outcomes-of-kipp-schools.
Inside Philanthropy. “Arthur Rock.” Accessed March 31, 2017. https://www.insidephilanthropy.com/guide-to-individual-donors/arthur-rock.html.
Inside Philanthropy. “Doris and Donald Fisher Fund: Grants K-12 Education.” Accessed March 31, 2017. https://www.insidephilanthropy.com/grants-for-k-12-education/doris-and-donald-fisher-fund-grants-for-k-12-education.html.
KIPP Bay Area Schools. “Results.” Accessed March 31, 2017. http://www.kippbayarea.org/results/.
KIPP Foundation. “About the KIPP Foundation.” Accessed March 31, 2017. http://www.kipp.org/about/.
KIPP Foundation. “Careers.” Accessed March 31, 2017. http://www.kipp.org/careers/.
KIPP Foundation. “Diversity.” Accessed March 31, 2017. http://www.kipp.org/about/diversity/.
KIPP Foundation. “Frequently Asked Questions.” Accessed March 31, 2017. http://www.kipp.org/faq/.
KIPP Foundation. “High Expectations.” Accessed March 31, 2017, http://www.kipp.org/high-expectations/.
KIPP Foundation. “KIPP.” Accessed March 31, 2017. http://www.kipp.org/.
KIPP Foundation. “KIPP Commitment to Excellence (Sample).” Accessed March 31, 2017. http://www.kipp.org/wp-content/uploads/2016/09/KIPP_Commitment_to_Excellence_Sample.pdf.
KIPP Foundation. “National Partners.” Accessed March 31, 2017. http://www.kipp.org/about/national-partners/.
KIPP Foundation. “Our Approach.” Accessed March 31, 2017. http://www.kipp.org/approach/.
KIPP Foundation. “Our Supporters.” Accessed March 31, 2017. http://www.kipp.org/about/national-partners/our-supporters/.
KIPP Foundation. “Professional Development.” Accessed March 31, 2017. http://www.kipp.org/careers/professional-development/.
KIPP Foundation. “School Environment.” Accessed March 31, 2017. http://www.kipp.org/approach/school-environment/.
KIPP Foundation. “Schools.” Accessed March 31, 2017. http://www.kipp.org/schools/.
KIPP Foundation. “What is a Charter School?” Accessed March 31, 2017. http://www.kipp.org/schools/charter-schools/.
KIPP Foundation. “What is it Like to Teach at KIPP?” Accessed March 31, 2017. http://www.kipp.org/careers/who-were-looking-for/teachers/.
KIPP Foundation: Independent Auditors’ Report and Consolidated Financial Statements. San Francisco, CA: Hood & Strong LLP, 2015. Accessed March 31, 2017.
http://www.kipp.org/wp-content/uploads/2016/09/KIPP_Foundation_Financials_2014-15.pdf
KIPP NYC. “Academic Results.” Accessed March 31, 2017. http://www.kippnyc.org/results/.
Mack, Julie. “Are Charter Schools Superior?: ‘Waiting for Superman’ Poses the Wrong Question About School Reform.” MichiganLive, October 26, 2010. Accessed April 3, 2017. http://www.mlive.com/opinion/kalamazoo/index.ssf/2010/10/are_charter_schools_superior_w.html.
Mathews, Jay. Work Hard. Be Nice.: How Two Inspired Teachers Created the Most Promising Schools in America. Chapel Hill, NC: Algonquin Books, 2009.
National Center for Education Statistics. “Elementary/Secondary Information System.”Accessed March 2, 2017. https://nces.ed.gov/ccd/elsi/tableGenerator.aspx.
North, Anna. “Should Schools Teach Personality?” New York Times, January 10, 2015. Accessed March 31, 2017. https://op-talk.blogs.nytimes.com/2015/01/10/should-schools-teach-personality/?rref=collection%2Ftimestopic%2FKnowledge%20Is%20Power%20Program%20(KIPP)&action=click&contentCollection=timestopics®ion=stream&module=stream_unit&version=latest&contentPlacement=1&pgtype=collection&_r=1.
Office of Civil Rights. “Civil Right Data Collection Data: Reports.” Accessed March 9, 2017. http://ocrdata.ed.gov/flex/Reports.aspx?type=school.
Smith, Hendrick. “Interview with Mike Feinberg, Co-Founder of Knowledge is Power Program (KIPP).” Making Schools Work. Accessed March 31, 2017. http://www.pbs.org/makingschoolswork/sbs/kipp/feinberg.html.
Snyder, Jeffrey Aaron. “Teaching Kids ‘Grit’ is All the Rage. Here’s What’s Wrong With It.” New Republic, May 6, 2014. Accessed March 31, 2017.
https://newrepublic.com/article/117615/problem-grit-kipp-and-character-based-education.
Taylor, Dora. “A Former KIPP Teacher Comments on Her Experience.” Seattle Education, March 25, 2012. Accessed April 3, 2017. https://seattleducation2010.wordpress.com/2012/03/25/a-former-kipp-teacher-comments-on-her-experience/.
The Atlantic Philanthropies. “Our Story.” Accessed March 31, 2017. http://www.atlanticphilanthropies.org/our-story.
Toll, Dacia, Richard Barth, and Brett Peiser, “Mr. Trump, Don’t Boost Our Budgets While Cutting Education: Charter School CEOs.” USA Today, March 28, 2017. Accessed March 31, 2017. http://www.usatoday.com/story/opinion/2017/03/28/trump-education-budget-needs-work-charter-school-ceos-column/99705262/.
Urban Charter School Study Report on 41 Regions 2015. Stanford,CA: Center for Research on Education Outcomes, 2015. Accessed March 31, 2017. http://urbancharters.stanford.edu/download/Urban%20Charter%20School%20Study%20Report%20on%2041%20Regions.pdf.
U.S. Department of Education. “Equity of Opportunity.” Accessed April 3, 2017. https://www.ed.gov/equity.
Watson Foundation. “Watson Foundation.” Accessed March 31, 2017. https://watson.foundation/.
Woodworth, Katrina .R., Jane L. David, Roneeta Guha, Haiwen Wang, and Alejandra Lopez-Torkos. San Francisco Bay Area KIPP schools: A study of Early Implementation and Achievement. Final report. Menlo Park, CA: SRI International, 2008. Accessed April 3, 2017. http://www.kippbayarea.org/wp-content/uploads/2010/06/SRI-International-Report.pdf.
Zinshteyn, Mikhail. “Survey: Many College Students Need A Lot More Than Academic Support to Succeed.” EdSource, March 8, 2017. Accessed March 31, 2017. http://www.kipp.org/news/survey-many-college-students-need-lot-academic-support-succeed/.
________________
[1] “About the KIPP Foundation,” KIPP Foundation, accessed March 31, 2017, http://www.kipp.org/about/.
[2] Julie Mack, “Are Charter Schools Superior?: ‘Waiting for Superman’ Poses the Wrong Question About School Reform,” MichiganLive, October 26, 2010, accessed April 3, 2017,
http://www.mlive.com/opinion/kalamazoo/index.ssf/2010/10/are_charter_schools_superior_w.html.
[3] See section five on student achievement.
[4] Jay Mathews, Work Hard. Be Nice.: How Two Inspired Teachers Created the Most Promising Schools in America (Chapel Hill, NC: Algonquin Books, 2009).
[5] Hendrick Smith, “Interview with Mike Feinberg, Co-Founder of Knowledge is Power Program (KIPP),” Making Schools Work, accessed March 31, 2017, http://www.pbs.org/makingschoolswork/sbs/kipp/feinberg.html.
[6] “About the KIPP Foundation,” KIPP Foundation, accessed March 31, 2017, http://www.kipp.org/about/.
[7] “KIPP Commitment to Excellence (Sample),” KIPP Foundation, accessed March 31, 2017, http://www.kipp.org/wp-content/uploads/2016/09/KIPP_Commitment_to_Excellence_Sample.pdf.
[8] Jeffrey R. Henig, “What Do We Know About the Outcomes of KIPP Schools?,” (New York: National Education Policy Center, 2008), accessed March 31, 2017, http://nepc.colorado.edu/publication/outcomes-of-kipp-schools.
[9] “Schools,” KIPP Foundation, accessed March 31, 2017, http://www.kipp.org/schools/.
[10] “Elementary/Secondary Information System,” National Center for Education Statistics, accessed March 2, 2017, https://nces.ed.gov/ccd/elsi/tableGenerator.aspx.
[11] “Civil Right Data Collection Data: Reports,” Office of Civil Rights, accessed March 9, 2017, http://ocrdata.ed.gov/flex/Reports.aspx?type=school.
[12] “What is a Charter School?,” KIPP Foundation, accessed March 31, 2017, http://www.kipp.org/schools/charter-schools/.
[13] “About the KIPP Foundation.”
[14] “Equity of Opportunity,” U.S. Department of Education, accessed April 3, 2017, https://www.ed.gov/equity.
[15] See Chart 1.
[16] See Chart 2.
[17] Henig, “What Do We Know About the Outcomes of KIPP Schools?”
[18] Katrina Woodworth et al., San Francisco Bay Area KIPP schools: A study of Early Implementation and Achievement. Final report., (Menlo Park, CA: SRI International, 2008), accessed April 3, 2017, http://www.kippbayarea.org/wp-content/uploads/2010/06/SRI-International-Report.pdf.
[19] Ibid.
[20] Henig, “What Do We Know About the Outcomes of KIPP Schools?”
[21] Joanne W. Golann, “The Paradox of Success at a No-Excuses School,” Sociology of Education 20 (10): 1-17.
[22] “High Expectations,” KIPP Foundation, accessed March 31, 2017, http://www.kipp.org/high-expectations/.
[23] “KIPP Commitment to Excellence.”
[24] Golann, “The Paradox of Success at a No-Excuses School.”
[25] “School Environment,” KIPP Foundation, accessed March 31, 2017, http://www.kipp.org/approach/school-environment/.
[26] Ibid.
[27] “Character Strengths, “ KIPP Foundation,” accessed April 3, 2017, http://www.kipp.org/approach/character/.
[28] See Chart 3.
[29] “Our Approach,” KIPP Foundation, accessed March 31, 2017, http://www.kipp.org/approach/.
[30] “KIPP,” KIPP Foundation, accessed March 31, 2017, http://www.kipp.org/.
[31] “School Environment.”
[32] Ibid.
[33] Ibid.
[34] Mikhail Zinshteyn, “Survey: Many College Students Need A Lot More Than Academic Support to Succeed,” EdSource, March 8, 2017, accessed March 31, 2017, http://www.kipp.org/news/survey-many-college-students-need-lot-academic-support-succeed/.
[35] Ibid.
[36] Jeffrey Aaron Snyder, “Teaching Kids ‘Grit’ is All the Rage. Here’s What’s Wrong With It,” New Republic, May 6, 2014, accessed March 31, 2017,
https://newrepublic.com/article/117615/problem-grit-kipp-and-character-based-education.
[37] Anna North, “Should Schools Teach Personality?,” New York Times, January 10, 2015, accessed March 31, 2017, https://op-talk.blogs.nytimes.com/2015/01/10/should-schools-teach-personality/?rref=collection%2Ftimestopic%2FKnowledge%20Is%20Power%20Program%20(KIPP)&action=click&contentCollection=timestopics®ion=stream&module=stream_unit&version=latest&contentPlacement=1&pgtype=collection&_r=1.
[38] KIPP Foundation: Independent Auditors’ Report and Consolidated Financial Statements (San Francisco, CA: Hood & Strong LLP, 2015) accessed March 31, 2017,
http://www.kipp.org/wp-content/uploads/2016/09/KIPP_Foundation_Financials_2014-15.pdf
[39]http://kippma.org/wp-content/uploads/2014/10/KIPP-Academy-Lynn-Annual-Accountability-Plan-Report-SY2014-20151.pdf
[40] Ibid.
[41] “National Partners,” KIPP Foundation, accessed March 31, 2017, http://www.kipp.org/about/national-partners/.
[42] “Our Supporters,” KIPP Foundation, accessed March 31, 2017, http://www.kipp.org/about/national-partners/our-supporters/.
[43] Ibid.
[44] “Watson Foundation,” Watson Foundation, accessed March 31, 2017, https://watson.foundation/.
[45] “Doris and Donald Fisher Fund: Grants K-12 Education,” Inside Philanthropy, accessed March 31, 2017, https://www.insidephilanthropy.com/grants-for-k-12-education/doris-and-donald-fisher-fund-grants-for-k-12-education.html.
[46] “Arthur Rock,” Inside Philanthropy, accessed Amrch 31, 2017, https://www.insidephilanthropy.com/guide-to-individual-donors/arthur-rock.html .
[47] “Our Story,” The Atlantic Philanthropies, accessed March 31, 2017, http://www.atlanticphilanthropies.org/our-story.
[48] “Professional Development,” KIPP Foundation, accessed March 31, 2017, http://www.kipp.org/careers/professional-development/.
[49] “Careers,” KIPP Foundation, accessed March 31, 2017, http://www.kipp.org/careers/.
[50] Ibid.
[51] Ibid.
[52] “Diversity,” KIPP Foundation, accessed March 31, 2017, http://www.kipp.org/about/diversity/.
[53] “Careers.”
[54] “Professional Development.”
[55] Ibid.
[56] Dora Taylor, “A Former KIPP Teacher Comments on Her Experience,” Seattle Education, March 25, 2012, accessed April 3, 2017, https://seattleducation2010.wordpress.com/2012/03/25/a-former-kipp-teacher-comments-on-her-experience/.
[57] John Ericson et al., Challenge and Opportunity: The Impact of Charter Schools on School Districts (Jessup, MD: RPP International, 2001), accessed March 31, 2017, https://www2.ed.gov/rschstat/eval/choice/district_impact.pdf.
[58] Urban Charter School Study Report on 41 Regions 2015 (Stanford,CA: Center for Research on Education Outcomes, 2015), accessed March 31, 2017, http://urbancharters.stanford.edu/download/Urban%20Charter%20School%20Study%20Report%20on%2041%20Regions.pdf.
While there may be charter management organizations (CMOs) that fail their students in providing a quality education, Aspire Public Schools is a model of a successful CMO. In existence for 19 years, Aspire serves over 16,000 students in 40 schools throughout California and in Memphis, Tennessee (however this report used data only from Aspire California schools). Aspire was founded on the mission to prepare all students for college, and based upon students’ yearly academic performance and college acceptance rates, Aspire appears to fulfill its stated purpose. Aspire consistently surpasses the available public alternatives. This CMO can pursue its goal of sharing its practices in order to help catalyze education reform in public schools across the nation. By building on its history of reform, Aspire has the capacity to become an education leader.
Methods
In order to evaluate data from the Aspire Public Schools of California, we used an online random number generator to conduct a sample of six Aspire schools: East Palo Alto School, Inskeep School, Summit Charter Academy, Richmond Tech Academy, and Capital Heights School. We then compared federal, state, and CMO data for these six schools with data for the school districts geographically surrounding them.
History, Pedagogy, and Mission
In 1998, public school educator Don Shalvey joined forces with Silicon Valley entrepreneur Reed Hastings to launch Aspire Public Schools, one of the nation’s first charter management organizations. Their mission was to: “grow the public charter school movement by opening and operating small, high-quality charter schools in low-income neighborhoods…and prepare these students for college” (“The History of Aspire”). For the past eight years, 100% of Aspire graduates secured admission to a four-year college or university. Aspire has stayed true to Dr. Shalvey’s vision of preparing students to earn a college degree. In regard to student demographics, this CMO serves predominantly low-income students. It values racial diversity and believes that the varied backgrounds of students and families help create a rich educational environment. Additionally, in order to ensure that students and families feel safe on their campuses, the schools do not collect any information about the immigration statuses of students, and have enacted policies prohibiting discrimination on the basis of race and national origin (“Commitment to Students”).
School Demographics
Aspire Public Schools monitors the racial and ethnic balance among its students annually, engaging in a variety of strategies to try to achieve a student population that reflects the community while honoring parent choice. In 2014, 8% of its students had disabilities compared to 12% in surrounding districts, and 28% were ELL compared to 25% in local districts (U.S. Department of Education).
Using data from the 2014-2015 school year, this graph compares the percentage of students of color in each school to that of the school’s district. SOC enrollment in the selected sample of Aspire schools is higher than in surrounding districts, except in the cases of East Palo Alto and Summit. In 2014, 79% of students between 5 and 17 years of age were from low-income families, compared to 74% in the districts they came from. Based on enrollment data alone, the Aspire mission of inclusivity holds true.
Using data from the 2014-2015 school year, we compared the percentages of students who received free and reduced lunch (FRL students) in the individual schools with that of their corresponding districts. While East Palo Alto School is a definite outlier, as it had no FRL students, the other four schools had a majority population of FRL students, three of which had larger percentages than the districts in which they belong (there was no free and reduced lunch data for the fifth school, Richmond Tech Academy). It is evident that Aspire serves disadvantaged populations, a goal that accentuates their exceptional standardized testing performance, graduation rate, and college prospects (Fensterwald).
Student Achievement
In 2014, the overall attendance rate for Aspire Public Schools was 96%; the attrition rate was 3.5%; the graduation rate in 2013 was 83%, compared to the California state average of 79%, and college attendance for 2012-2013 was 87%. The graduation rate for network students from low-income families was 84%, compared to the state average for that group of 73%. Aspire students graduate with over 15 college credits already complete, so their completion rate of college courses required for admittance to California State or University schools is higher than that of local districts and California as a whole (U.S. Department of Education). Unfortunately, however, there is no available data on the college success and graduation rates of students who graduate from Aspire schools.
Additionally, the California Standards Tests are given to students in grades two through eleven each spring, and over the past four years, more Aspire students have scored Advanced/Proficient (A/P) than typical students in neighboring districts (that serve similar demographics of students) and statewide.
School Discipline
On average, the in-school suspension percentage of this CMO’s schools is higher than that of the surrounding districts. In three of the charters, the Aspire school’s rate of suspension is about three times higher than the district average. This may be the result of Aspire schools having stricter disciplinary practices than their surrounding districts, even though they do not outwardly display or advertise having a “no-excuses” policy. The only other available disciplinary data about this district and this CMO’s schools concerns school related arrests, but there were only school related arrests in Inskeep Aspire School. The percentage of arrests in Aspire Schools is less than that of the their surrounding districts, and the data is not available to see if these arrests are the result of violent or nonviolent incidents. However, the data does show that Black and Latino students are most likely to be arrested. Disciplinary action in the Aspire schools is decided by the CMO’s Board of Directors, and each individual school’s Advisory School Council (ASC). An ASC consists of the principal, two teachers, two parents, one member of the chartering district’s Board, and one community member at large. It acts as an initial discipline review board, addresses school safety issues, reviews parental concerns, determines budget priorities, and sets policies that are unique to the school (“Accountability”). There are no areas of the Aspire Public Schools’ publications that advertise the schools as “No Excuses”, and the school has no history of “No Excuses” practices, as the CMO only results to expulsion if a student has a history of misconduct, such as over twenty suspensions in a single school year, or if a student’s presence causes continuous danger to other students (“APS Student Family Handbook”). There is no public controversy concerning student discipline with Aspire Public Schools.
Marketing and Media
The Aspire Public Schools advertise themselves as being inclusive, diverse, and accessible. On its home page, one will find a huge picture of a classroom of all black and brown students, the primary demographic of Aspire Public Schools in California. These schools operate on the platform of college for certain, with the slogan “make college the expectation, not the exception” also clearly visible on the APS home page (“Commitment to Students”). They are open about their inclusivity, as they also advertise on their website (including on their homepage) that they serve undocumented students and students of undocumented families (“Commitment to Students”). In addition, the Aspire website provides its enrollment directions in Spanish, to ensure that the large Latino population that they serve can properly matriculate to their schools. In the media, Aspire Public Schools have been mentioned, surprisingly, in opposition to budget cuts of district schools, even if more funding is directed towards charter schools like their own (Toll et.al, USA Today). There is also an ongoing litigation between the California Department of Education and the Concerned Parent Association, concerning the Family Educational Rights and Privacy Act, and the APS website notifies its parents and students with directions to anyone wishing to object to presenting their personally identifiable information (“Accountability”). This implies that Aspire schools cater to the educational needs of immigrant families, regardless of their legal status.
Accountability and Oversight
Each Aspire school is governed by Aspire’s Board of Directors, but they encourage all stakeholders, including families, staff members, administrators, and community leaders, to take responsibility in the students’ education process. Each year, Aspire compiles information concerning progress across various metrics into an accountability report, which is available to the public. These reports include student enrollment demographics, teacher’s credentials, students CAASPP test scores, school climate data, class sizes, student fitness standards, and employee salaries. The Aspire data seems to be consistent with the state data and meet state standards. Aspire Public Schools is also committed to equal opportunity for all individuals in education, and is a Title IX compliant CMO (“Accountability”). It clearly displays that it is a 501(c)3 non-for-profit CMO, and states that because it is often easier for a group to work together to run a charter school, they banded different individuals of different areas together to run multiple charter schools (“FAQs”). Aspire provides lists of their different donors and investors and includes the range of donations that each person or organization gave for the operating year (“Partners and Investors”). In terms of how much of this money goes to the school compared to the CMO, there is no information readily available. Aspire Public Schools has not had any financial scandals or questionable financial interests in the media.
Funding
The Aspire CMO website shares its financials dating as far back as the 2008-2009 fiscal year, as well as some transparent information about its sources of funding. Aspire Charter Schools receive funding from a broad range of sources, both public and private.
The CMO receives federal, state – from California and Tennessee – and local funding from property taxes. In the 2015 fiscal year, the highest proportion of funding came from the state followed by federal and local funding (“ Quarter Financial Report”). The Aspire CMO is additionally funded through private grants and contributions from donors. The list of “Partners and Investors” includes the Bill and Melinda Gates Foundation and Netflix co-founder and CEO Reed Hastings, both donating more than $1 million to the CMO. The Bill and Melinda Gates foundation has a history of supporting charter schools, hoping to “increase the number of academically strong seats in charter networks that serve students of color and low-income populations”(“Charter School Growth Fund”). The Foundation has worked with Aspire because it is a “high performing CMO”(“Aspire Public Schools”). Hastings, too, is an outspoken advocate of charter schools – currently serving on the board of the KIPP Foundation and previously serving on the California Board of Education (Huddleston, 2016). The Bill and Wells Fargo, Eli and Edythe Broad Foundation, and Chevron are among other higher profile institutions to donate to the CMO (“Partners & Investors”).
Staffing
Although the Aspire website argues that “Aspire is not a teacher-training institute” (“Effective Teachers”), the Aspire Public Schools network does offer its own comprehensive programs for earning teacher credentials, referred off-hand as being “Aspiratized” (Tucker 2011). Essential to this program are Aspire’s “Instructional Coaches,” or existing teachers who operate in two-year mentorship roles for new teachers, and the “Teacher Effectiveness Model,” a framework for reflective practice and self-evaluation (“Teacher Development”). Aspire also offers a Teacher Residency Program for prospective college graduates which, although an attractive financial option, has only attracted a few dozen students per year since its inception. That said, Aspire schools suffer from teacher attrition as much or more than their surrounding districts, like in Oakland, where the retention rate for Aspire teachers is only 75% (Mongeau 2015).
As explored above in “Student Achievement,” Aspire’s graduation and college enrollment rates are significantly higher than its surrounding districts, a clear positive indicator for Aspire’s pedagogy. Aspire’s pedagogy of teaching relies heavily on the “Blended Learning” model, which incorporates self-guided online learning in the style of services like Khan Academy. Data is perhaps Aspire’s most important driver of teacher improvement. In fact, each Aspire school has an actual “data driver,” or a teacher given the additional responsibility of implementing available data into teacher evaluation and feedback. This blend of hard data with best-practice resources helps to develop the standardized Aspire brand of pedagogy (“Teacher Development”).
Relationship to the District
Aspire, in line with the original rhetoric of charter school pedagogy, stresses heavily its commitment to collaboration and shared best-practice. However, we were unable to find any specific examples or evidence to demonstrate a relationship between the pedagogy of Aspire schools and the surrounding districts. The Aspire websites states, “To date, our collaboration with other school systems has taken a wide variety of forms ranging from instructional to financial.” Aspire opens its doors to tours and partnership meetings with other schools, and intends for its “College Ready Promise” to be a message not only for Aspire schools but also for the broader district as well. Interestingly, Aspire developed its own online school evaluation system, Schoolzilla, available for free to educators, which processes data into tangible guidelines for improvement and is currently in use in 500 schools in ten states (“Collaboration,” “Schoolzilla”). That said, while stressing the importance of the district context, Aspire seems to focus more on the expansion of their own charter network, and not necessarily on nurturing other individual partnerships. Aspire makes a concerted effort to interact with the surrounding community and to be transparent in its pedagogy and offerings, but focuses more on their own practice in their push for new charters rather than their impact on the districts in which their schools reside.
Conclusion
Aspire’s mission is to build the public charter school movement by opening high-quality charter schools in low-income neighborhoods and preparing these low-income students for college (“The History of Aspire”). This mission set forth by Aspire launchers Don Shalvey and Reed Hastings addresses the purposes of education set forth by Labaree of democratic equality, social efficiency, and social mobility (Labaree, 1997). Public schools should offer a quality education that provides all students, regardless of race or socioeconomic status, the tools to succeed civically, economically and socially. The Aspire CMO believes that the expansion of its network of high performing charter schools is accomplishing that through the expansion of the opportunity to attend college.
The students in high performing schools are better equipped to engage civically and to advance socially and economically. Aspire’s students outperform both their district and state peers in California Standards Tests in math and language arts. This high performance of Aspire’s predominantly low-income students has led to an eight year long 100% acceptance rate to four year colleges. Aspire’s “College for Certain” mentality addresses the purposes of education by noting the opportunities provided by a college degree. Namely, the students’ acquisition of skills needed to “support themselves and a family throughout life,” and the ability to contribute their time and talents to their communities” (“College for Certain”). Aspire’s high performance gives its students the opportunity for higher education, better equipping students to achieve better social position as well as become better citizens, fulfilling the role that a public school should.
Word Count: 2498
References
Aspire Public Schools Secures Bond Financing for Facilities. (n.d.). Retrieved from http://www.gatesfoundation.org/Media-Center/Press-Releases/2010/05/Aspire-Public-Schools-Secures-Bond-Financing-for-Facilities
Aspire Public Schools. (2015, November). Aspire Public Schools: Application for Sheffield Elementary (p. 3, Rep.).
Fensterwald, J. (2013, June 25). More charters, including those in California, outperform district schools in reading, study says. Retrieved from https://edsource.org/2013/more-charters-including-those-in-california-now-outperform-district-schools-in-reading/34234
Huddleston, J. T. (2016, January 13). The CEO of Netflix Is Making a Huge Donation to Education. Retrieved from http://fortune.com/2016/01/13/reed-hastings-100-million-education/
Labaree, D. F. (1997). Public goods, private goods: The American struggle over educational goals. American Educational Research Journal, 34(1), 39-81.
Mongeau, L. (2015, September 9). Teachers Wanted: Passion a Must, Patience Required, Pay Negligible. Retrieved April 19, 2017, from https://www.theatlantic.com/education/archive/2015/09/teachers-wanted-passion-a-must-patience-required-pay-negligible/404371/
Student Family Handbook, 2013-2014 | Aspire Public Schools. (n.d.). Retrieved from http://aspirepublicschools.org/media/filer_public/2013/11/04/aspire_student_family_handbook.pdf
Schoolzilla. (n.d.). Retrieved April 4, 2017, from http://www.educationpioneers.org/where-we-work/partners/schoolzilla
By Alison Levosky, Amalia Ono, Esteban Elizondo, and George Huynh
Introduction
Charter schools across the nation have a range of academic performance from student bodies of wildly varying demographics. BASIS charter schools fall at the very top in academic performance standards as measured through the Programme for International Student Assessment (PISA), and through Advanced Placement (AP) testing relative to the rest of the country. It is easy and even natural to look at a school with high test scores and think that the school is doing everything right for its students, and should be seen as a model for other schools. However, many factors lie beneath the apparent success of high-scoring schools. Welner (2013) points out a number of ways that charter schools can influence school enrollment to get the already-high-achieving students they want, including attrition bias, selection bias, and lack of necessary services for high-need students. Wilson and Carlsen (2016) also explain that schools market their websites specifically to attract a select group of students by signaling a specific “fit” from which many students are excluded. In these ways, and a variety of others, schools like BASIS can look like excellent, world-class schools, but in reality they only appear that way because some populations are excluded from the school. This report discusses the lesser-known details of the seemingly idealistic BASIS.ed charter management organization (CMO), and the ways its mission manifests itself and provides favorable outcomes for only a specific subset of students.
Methods
In order to evaluate data from BASIS CMO, we conducted a random drawing of six of the CMO schools using an online random number generator. We then compared federal, state and CMO data for these six schools with data for the school districts geographically surrounding them. While there was initially some difficulty finding data on demographics and free or reduced-lunch, data was eventually retrieved from the National Center for Education Statistics.
History, Pedagogy, and Mission
The first BASIS school was founded in 1998 in Tucson, Arizona. From 2003 to 2016, BASIS.ed opened 20 more public charter schools, most of which are in Arizona, but also include schools in Texas and Washington, D.C. (Timeline and Growth, 2017). The data presented in this report come from six BASIS schools in Arizona, including BASIS Phoenix, BASIS Chandler, BASIS Mesa, BASIS Prescott, BASIS Flagstaff, and BASIS Tucson North, which serve about 3,500 students altogether.
Olga Block co-founded BASIS Charter Schools with her husband, Michael, two years after she moved to the U.S. from Prague, with the philosophy that “nothing is for free, and if you want to succeed you must work very hard” (Lopatin, 2016). She worked as a professor of economics in Prague, and upon learning about the practices of education in the U.S., brought back some of those concepts to the Czech Republic before coming back to the United States (Lopatin, 2016). When asked about the vision of the BASIS schools, the founders said that “the goal of a great education is to provide students with choices, with unbounded opportunities, to send them to college and into their professional lives empowered by the broad and deep content knowledge and critical thinking skills that will enable them to craft their own futures” (About BASIS.ed, 2016). They want to create some of the “best schools in the world,” and according to BASIS.ed scores on the PISA exam, students are well on their way to proving that mission—and as BASIS likes to emphasize, they even score better than high-performing students in Shanghai (International Benchmarking, 2016), which is usually one of the highest performing regions on the PISA exam. The curriculum from grades K-12 emphasizes critical thinking, organizational skills, time management, and high-level content standards (Curriculum Overview, 2017). BASIS.ed has no particular target population of students, and instead appears to open its doors to any students looking for a challenging academic experience. However, as shown below, the demographics of the BASIS schools present a vastly different narrative.
School Demographics
All data in this section are from the National Center for Education Statistics (Elementary/Secondary Information System, 2017). Relative to the surrounding districts, the BASIS schools we studied tended to have fewer students of color—in some places more dramatically than others, like BASIS Phoenix. In fact, it tends to be the case that “BASIS establishes schools only where mostly white, affluent families live” (Alonzo, 2014). This is particularly different from the demographics of most charter schools, which generally have more students of color than traditional public schools in the same area. The only BASIS school in this report that enrolled significantly more students of color than the surrounding district was BASIS Chandler, and in this case it was because the majority of students were Asian; there were very few Black and Hispanic students in that population.
For the 2014-2015 year, the NCES had no data for English Language Learners, students who receive free or reduced lunch, or students in special education, but other sources provide data and a heavy criticism of the fact that BASIS schools tend to lack students from these populations. For example, in a 2017 Washington Post article by Valerie Strauss, about BASIS Schools in Arizona, the difference between BASIS schools and their surrounding districts is clear:
“In 2015-16, only 1.23 percent of the students at BASIS had a learning disability, as compared to 11.3 percent of students in the state. BASIS schools had no English Language Learners. And in a state in which over 47 percent of all students received free or reduced-priced lunch, BASIS had none. Although BASIS may have some students from qualifying households, it chooses not to participate in the free or reduced-priced lunch program.”
It is evident from this information that BASIS charter schools typically tend to increase the segregation of schools in comparison to the district. This disparity may come from the fact that the missions of charter schools typically focus on closing the achievement gap, but the BASIS.ed CMO focuses on creating world class schools. In other words, it seems as though the priority of the CMO is to bring in students who are already prepared to perform excellently in their academics, in order to create the impression of a world class school.
Student Achievement
Much of the information available on the official BASIS charter website details the aggregate achievement of all BASIS charters. Included in this information are results to BASIS’s 2016 OECD, an exam taken by fifteen-year-old students comparable to the international PISA exam. According to the website, BASIS students tested above the highest-ranked school systems in the world, including private schools in the U.S. and Shanghai (International Benchmarking). BASIS’s national percentile ranking among schools is 1% in math, reading, and science and its international percentile ranking is 3% in math, reading, and science based on the OECD exam.
In 2016, U.S. News & World Report ranked BASIS Scottsdale as the second best high school, the best charter school, and fourth best STEM school in America (National Rankings). BASIS Tucson North was ranked the third best high school, the second best charter school, and the sixth best STEM school. BASIS Oro Valley was ranked the sixth best high school and the third best charter school in the nation. In the same year, The Washington Post ranked BASIS Oro Valley, BASIS Flagstaff, and BASIS Tucson North among America’s most challenging high schools. BASIS Chandler, BASIS Peoria, and BASIS Scottsdale were instead included on the list of “Top Performing Schools with Elite Students”. These credentials are easily available and even touted on the BASIS charter website. In addition, in considering these rankings, the international comparisons that BASIS pushes make all the more sense, as U.S. News & World Report has put it comfortably at the top of U.S. schools—BASIS is looking to a more competitive pool to validate its scores.
Whereas American high school graduates earned an average score of 2.85 out of 5 and passed 57.5% of AP exams, 2016 BASIS graduates took an average of 11.5 AP exams, 86% of which were passed with an average score of 3.78 (Advanced Placement, 2016). However, it should be mentioned that this high average of AP tests taken is due to the curriculum of the schools, with AP courses being a compulsory part of the BASIS education beginning as early as eighth grade (Ono). In addition, BASIS conducts mock AP exams in the month of April in which it is mandatory of students to come in on the weekend to take a previously released AP exam in the AP course they are taking as if it were a real AP exam. All students then receive their scores and talk extensively to their teachers on what can be approved for the actual exam, which is certainly a privilege and advantage not given at other schools (Ono, 2017). 48.6% of BASIS AP test takers earned some sort of AP Scholar Award, compared to 23.1% globally (Awards and Distinctions, 2017). For the 2016 National Merit Scholar recognition, 36.6% of BASIS students received commended or better, including National Merit Finalist and Semi-Finalist, compared to 3.3% of American students. However, these scores may have been impacted somewhat by the practice of having mandatory PSAT examinations for ninth and tenth graders and PSAT workshops on the weekends in the preceding weeks to the exam (Ono, 2017).
In 2016, the average BASIS student earned a score of 1,353 out of 1400 on the SAT exam and a 30.0 out of 36 on the ACT exam compared to 1,002 on the SAT and 20.8 on the ACT for the average American student (College Entrance Exams, 2017). In 2015, BASIS students earned an average of 2,029 on the SAT, while college-bound Arizona seniors earned an average of 1490 (State Profile Report, 2015).
Average Score on College Entrance Examinations
Graph retrieved from BASIS.ed
BASIS graduates had an acceptance rate of 51.4% to the top 100 ranked universities and colleges on the U.S. News & World Report in 2016 (College Acceptances and Scholarships). Those graduated also earned almost $38 million in total merit aid. In the list included of the number of 2014-2016 BASIS graduate acceptances, 20 had been accepted by Brown University, 10 had been accepted by Harvard University, 7 had been accepted by MIT, 9 had been accepted by Princeton University, 20 had been accepted by Stanford University, and 11 had been accepted by Yale University. These facts are also readily available, and contribute to an overall environment heavily focused on achievement via acceptance to selective colleges. This is also evident in the college acceptance boards posted in hallways and selective college pennants hung in communal spaces such as the cafeteria (Ono, 2017). BASIS schools also conduct an “award ceremony” at the end of each trimester, in which students are all gathered together and several distinct categories of achieving students are called up in front of their peers and awarded with dog tags corresponding to their achievement. The categories are “Most Improved”, “Honor Roll” (students within the top 15%; these students receive silver dog tags), and “Distinguished Honor Roll” (students within the top 5%; these students receive gold dog tags) (Ono, 2017). This practice begins in the fifth grade, and only serves to foster the competitive environment. Some of the BASIS schools use balloons instead of dog tags for maximized visibility.
However, although all of the previous statistics are provided through the BASIS charter website, the results on the Arizona standardized exam, AzMerit, support the trend of the provided information: on the 2016 exam, the statewide percentage of students grades 5 through 11 had a passing rate on the mathematics portion of anywhere between 26-46% and a passing rate on the English language arts portion of anywhere between 29-45% (Department Releases Preliminary 2015-2016 State Level AzMerit Results). In comparison, BASIS schools had passing rates between 70-100%, with BASIS Chandler at a high of 93% for mathematics and 92% for English language arts (Search AzMerit Results).
School Discipline
From the information available on our six schools (BASIS Phoenix, BASIS Chandler, BASIS Mesa, BASIS Prescott, BASIS Flagstaff, and BASIS Tucson North) within the BASIS Charter Management Organization, it seems as though there is virtually no disciplinary action taken. The only two schools where suspensions were given out were BASIS Mesa, with a mere two white students receiving one or more in-school suspensions, out of 351 total students, and BASIS Tucson North, where two Hispanic students received one or more in-school suspensions, out of 913 students. That amounts to four suspended students in our six schools out of 3,130 students, or a rate of 0.13%. Relative to their surrounding districts, this percentage is incredibly low, given that schools around BASIS Mesa had a rate of 7.47% of their students receiving one or more in-school suspensions, and schools around BASIS Mesa totaling a rate of 3.28%. Collectively, all the district schools around our six BASIS charter schools had a significantly higher suspension or arrest rate, at 5.19%, with 10,223 students suspended or arrested out of 197,163 total enrolled students. The amount of disciplinary action taken in public district schools is about 300 times greater than their neighboring charter schools. It is likely that the relatively small size of the schools and the exclusionary, selective nature of the admission process employed by BASIS lead to extremely low disciplinary rates.
Marketing and Media
Much of the advertising around BASIS schools is highly focused on test results on the OECD exam, SAT exam, and AP exams, as well as college acceptances. In its marketing, BASIS draws constant comparisons between the scores on these exams taken by BASIS students and the U.S. and international averages. The BASIS Charter Schools website goes into very fine detail in this regard, including a comprehensive list of college acceptances and multiples graphs representing the performance of BASIS students. For instance, below is the performance of BASIS students on the OECD exam:
The marketing is highly dependent upon quantitative measures of success. In addition, this CMO has been in the news a fair amount, with news outlets expressing anything from fascination (Why Are 2 of U.S. News’s Top 5 ‘Best High Schools’ Arizona Charter Schools?), to admiration (High Scores at BASIS Charter Schools), to disgust (What the public isn’t told about high-performing charter schools in Arizona). Either way, BASIS schools have gained much publicity in the wake of success. Below is the advertisement video that demonstrates the above-named characteristics of BASIS marketing. This video also demonstrates BASIS’s international focus mentioned in the achievement section. The message of said video seeks to push the idea of the BASIS model as the solution to America’s low international testing rank with most of its evidence grounded mainly in test results. Any sort of student growth or happiness beyond scores goes unmentioned.
Accountability and Oversight
With 18 BASIS charter schools in Arizona, three in Texas, and one in Washington, BASIS Educational Group, LLC has exploded ever since BASIS Tucson and BASIS Scottsdale became top-ranked schools on Newsweek’s “America’s Most Challenging High Schools List” and eventually rose to the Best High Schools list of U.S. World News & Report (Burris, 2017). The BASIS charter schools are self-acclaimed “no-excuse” schools, as attrition rates exceed 50%. Burris tersely explains the cause of this high figure: “During each successive year, students leave when they cannot keep up with excessive academic demands.” There is almost no regulation by the government for the unethical practices that BASIS seems to employ, as “salary and travel transparency disappeared in 2009 when the Blocks, managers of two BASIS schools, opened a private, for-profit limited liability company, BASIS Educational Group, LLC” (Burris, 2017). The most recent audit has revealed significant losses, and a total deficit of over $13 million. This is particularly troublesome given that BASIS continues to operate without actually having enough money to pay their teachers and administrators, and no one is stopping their illegal practices stemming from an apparent conflict of interests that arise from allowing a for-profit entity to exist alongside a non-profit one.
Regarding testing accountability, all BASIS schools in Arizona, Texas, California, and DC are required to take the same state-mandated tests that public schools are required to take (Kronholz). However, BASIS schools place heavy emphasis on Advanced Placement exams. These charter schools are not exempt from federal testing regulation. Teacher regulation is also less stringent than in public schools. These teachers are not unionized, and there is no teacher certification (Sullivan). In fact, the Chairman of BASIS Charter schools, Craig R. Barrett, explicitly lists these as barriers to to how much students are learning in his message to the program (Barrett). While students are expected to be held accountable through state-mandated tests, it does not appear that charter school teachers fall under these same regulations.
Funding
As a charter organization, BASIS schools are publicly funded but not to the extent of public district schools. In Arizona specifically, charter schools are funded $1,180 less than the average district student (Charter Schools). However, BASIS schools raise a considerable amount of money from parental contributions, with a suggestion of families giving at least $1,500 a year per child for the teacher bonus program (What the public isn’t told about high-performing charter schools in Arizona, 2017). At some BASIS schools, donors may be memorialized publicly, such as with BASIS Scottsdale’s “Legacy Bricks” (Legacy Brick Campaign). BASIS schools also enjoy the support of benefactors—for example, BASIS Scottsdale has received funding from Craig Barrett, the former chairman of the board of the Intel Corporation, chairman of BASIS Charter schools, and namesake of the Barrett Honors College at Arizona State University.
Staffing
BASIS has an aesthetically-pleasing, attractive recruitment website called www.jobs.basised.com, where teachers and managers can find images of motivated students, available job postings, and messages coaxing them to join BASIS, such as “Join the Revolution—Help Lead the Revolution,” as well as a variety of thoughts from current teachers (About BASIS.ed, 2016). Locations include their base of Arizona, Texas, New York, California, Washington, D.C., Virginia, Washington State, and even China. Openings are categorized into primary school teaching, middle/upper school teaching, school management and administration, central office, non-teaching school staff, and marketing & student recruitment. Listed separately under job qualifications for open teacher or administrative positions are “minimum qualifications,” which includes “a Bachelor’s degree or minimum of 3 years teaching or administrative experience and valid fingerprint clearance,” and “preferred qualifications,” entailing experience with children, proficiency in Microsoft Office skills, a high level of of personal responsibility and optimism, strong communication skills, and comfort with a fast pace of learning. It’s clear that BASIS prefers experienced, motivated teachers, as any group of selective, competitive schools would.
Relationship to the District
BASIS Charter Schools have an insignificant-to-no relationship to their surrounding school districts. They do not participate in organized sports with the local school district due to the cost of competing in them (Sullivan). For example, Tucson North participates in an alternative sports league rather than the costly, larger league in Arizona. Students who wish to compete at a higher level will join club sports teams, and may interact with students from the main district through these leagues but this is largely incidental. A former student described her school’s relationship with the local district-run high school as “indifferent to slightly hostile”. However, she noted that this relationship was “just due to proximity” (Ono). BASIS Charter operates independently and does not work with local school districts.
Conclusion
BASIS Charter schools have surged to the top of school rankings and emerged as some of the premier charter schools in the country. However, their ascent to the top has not been without controversy. While BASIS students are admitted by lottery, their retention is not nearly as random. Practices such as not taking part in free or reduced lunches can potentially turn away some families from the schools. The for-profit corporation managing them has come under fire for transparency issues, and this has generated controversy for the publicly-funded entity.
That being said, there is no denying BASIS success on national, standardized test scores. Their performance significantly surpasses the surrounding area and even the nation. The top BASIS schools are on-par with the best schools across the world, and the charter corporation does not shy away from these statistics. Their undeniable success on paper forms the core of their advertising campaign as they hope to attract high-achieving students to enter their lottery. Once students are a part of BASIS schools, they become part of aschool system which sees over 50% of its students walk out the door before graduation, an attrition rate more than two times higher than West Point. The apparent success of these schools, juxtaposed with their controversies, perhaps perfectly highlights some of the key issues in the charter school debates. While we can quantify the strong academic performance of the school, academic performance is not the sole indicator of school success. High-performing charter schools can be selective about the students they take in through various means, which alters the pool of students they educate (Welner 2013). By being more selective with the students they take in and the students they retain, BASIS is able to achieve success on paper, while failing the students that have to walk out its doors. There is no denying the academic success of its graduates, but instead of simply taking high-achieving students out of the surrounding district schools, BASIS needs a more inclusive and comprehensive solution for all students.
About Charter Schools | Arizona Charter Schools Association. (n.d.) Retrieved March 30, 2017, from https://azcharters.org/about-charter-schools/
Advanced Placement | BASIS Charter Schools. (n.d.) Retrieved March 30, 2017, from http://www.basisschools.org/achievement-and-results/advanced-placement.php
Alonzo, M. (2014, May 29). Arizona Charter Schools Often Ignore Latino Students and English-Language Learners. Retrieved March 29, 2017, from http://www.phoenixnewtimes.com/news/arizona-charter-schools-often-ignore-latino-students-and-english -language-learners-6462476
Awards and Distinctions | BASIS Charter Schools. (n.d.) Retrieved March 30, 2017, from http://www.basisschools.org/achievement-and-results/awards-and-distinctions.php
Barret, C. (n.d.). BASIS Charter Schools [Brochure]. Author.
College Acceptances and Scholarships | BASIS Charter Schools. (n.d.) Retrieved March 30, 2017, from http://www.basisschools.org/achievement-and-results/college-scholarships.php
College Entrance Exams | BASIS Charter Schools. (n.d.) Retrieved March 30, 2017, from http://www.basisschools.org/achievement-and-results/college-entrance-exams.php
Curriculum Overview. (2017). Retrieved March 28, 2017, from http://www.basisschools.org/academics/curriculum-overview.php?school=8
Department Releases Preliminary 2015-2016 State Level AzMERIT Results. (2016, June 27). Retrieved April 23, 2017, from http://www.azed.gov/superintendent/2016/06/27/department-releases-preliminary-2015-2016-state-level-azmerit-results/
International Benchmarking. (2016). Retrieved March 28, 2017, fromhttp://www.basisschools. org/achievement-and-results/international-benchmarking.php
Kronholz, J. (2014). High Scores at BASIS Charter Schools. Retrieved March 30, 2017, from http://educationnext.org/high-scores-at-basis-charter-schools/
Legacy Brick Campaign | BASIS Scottsdale. (n.d.) Retrieved March 30, 2017, from http://www.basisscottsdale.org/legacy-bricks.aspx?_ga=1.104025216.1269707764.1491005137
Lopatin, S. (2016). College prep is charter school founder’s mission. Retrieved April 20, 2017, from http://www.azcentral.com/story/money/business/2015/06/17/whos-who-2015-olga-block/71134270/
National Rankings | BASIS Charter Schools. (n.d.) Retrieved March 30, 2017, from http://www.basisschools.org/achievement-and-results/national-rankings.php
Ono, M. (2017, March 31). BASIS Charter [Telephone interview].
Richmond, E. (2013, April 23). Why Are 2 of U.S. News’s Top 5 ‘Best High Schools’ Arizona Charter Schools? Retrieved March 30, 2017, from https://www.theatlantic.com/national/archive/2013/04/why-are-2-of-i-us-news-i-s-top-5-best-high-schools-arizona-charter-schools/275211/
Search AzMERIT Results By School, District. (2016). Retrieved April 23, 2017, from http://kjzz.org/az-merit-search?school=BASIS&district=All&county=All&field_year_value%5Bvalue%5D%5Byear%5D=2016
State Profile Report, Arizona. (2015). Retrieved March 30, 2017, from https://secure-media.collegeboard.org/digitalServices/pdf/sfat/AZ_15_03_03_01.pdf
Sullivan, M. (2017, January 04). What Are BASIS Charter Schools And How Are They Rewriting The Education Rules? Retrieved March 31, 2017, from https://www.forbes.com/sites/maureensullivan/2016/05/23/what-are-basis-charter-schools-and-how-did-they-rewrite-the-education-rules/#5965bc51f9ca
Welner, K. G. (April 2013). The Dirty Dozen: How Charter Schools Influence Student Enrollment. Teachers College Record. [online], http://www.tcrecord.org ID Number: 17104.
Wilson, Terri S and Robert L Carlsen. 2016. “School Marketing as a Sorting Mechanism: A Critical Discourse Analysis of Charter School Websites.” Peabody Journal of Education91(1):24-46.
By Alejandra Corona-Ortega, Sara Harris, Elijah Mas, and Ben Wong
Success Academy is billed as the largest, highest performing charter network in New York City, but is that the entire story? At first glance, the results point to significantly high student performance, especially compared to the surrounding New York City public schools. There has been no lack of controversy, however, surrounding this network, especially related to disciplinary policies, potentially biased enrollment, and fiscal management. In light of allegations and mixed reactions, the network has often failed to provide transparent explanations for their actions or solutions. This leaves room for skepticism that Success Academy is not actually meeting the needs of the entire student population within the context of NYC public schools, even considering reports of such high performance. After weighing the existing data on student outcomes against counter claims we believe that Success Academy as it stands provides NYC families with a quality alternative to traditional public schools, but we do not support the network’s plans for rapid expansion until it improves transparency and public accountability.
Methods
In order to evaluate data on Success Academy, we conducted a random drawing of six Success schools using an online random number generator. We then compared federal and state data for these six schools with data for the school districts geographically surrounding them. Student demographic and discipline data were collected from the NCES Elementary and Secondary Information System. Student achievement and attrition data, albeit limited, were collected from the NYSED data site. We made extensive use of Success Academy’s website in order to understand the network’s unique brand and student experience. Realizing that Success Academy’s own marketing materials are heavily biased, we also sought news articles, employee reviews, and independent reports that highlight potential counter-narratives from teachers, parents, and other stakeholders.
History, Mission, and Pedagogy
Eva Moskowitz, an educator and leader in different levels of education and government, founded Success Academy in 2006. The network currently has 41 schools and educates 14,000 K-12 students. It utilizes lottery admission.
The stated purpose of the organization is the realization of success in children from all backgrounds. Ninety-three percent of students in Success schools are students of color (SOC), according to the organization’s website.
Success schools are driven by a holistic pedagogy, with a focus on critical thinking, core knowledge, cultural experiences, independent study and electives for secondary students, and college readiness, the precursors of which begin in the earliest years. In the upper grades, independent learning is stressed, and students are offered different opportunities for enrichment (elective courses, summer programs, etc.). STEM is an important part of the curriculum, and a special STEM diploma is available for high school students who choose to pursue it; even kindergarteners do science experiments.
Students are expected to hold themselves accountable, challenge themselves to grow, and persevere through difficulty. The organization seeks to foster a sense of community within its walls and in its neighborhoods; students are encouraged to support one another, and parental involvement is expected (Success Academy Official, 2017).
That Success students truly learn to be independent is, of course, not guaranteed. An evaluation of the Bronx 2 school (one of the schools in our sample) in the 2010-11 term by SUNY’s Charter Schools Institute (SUNY-CSI) reported that teachers indeed challenged students academically and encouraged a variety of thinking skills. However, it also found the following:
Teachers implement the school’s comprehensive behavior or management system with fidelity… They use various tactics to elicit class attention or compliance, such as clapping hands or repeating ‘track’ and other key phrases. Occasionally teachers demand 100 percent compliance with directions, requiring multiple admonitions that interfere with the flow of the lesson and learning time. … Teachers continually provide students with directions and praise for quiet student activity and quick transitions.
SUNY-CSI reports that the positive effect of this culture is that students understand clear expectations that they will not disrupt the learning process. It also states that with regard to the school, “the great majority of parents… have strong positive attitudes.” (Charter Schools Institute, 2011) The long-term impacts of this kind of instruction, however, remain nebulous.
Demographics
To examine whether Success abides by its principle of maximizing the potential of students from all backgrounds, we briefly examined the schools’ demographics in the 2014-15 term. In most cases, the sample schools have higher SOC enrollment than their surrounding districts. Two of the three districts in which these schools are located have similar SOC concentrations to Success Academy on the whole:
The distributions vary for students who are traditionally disadvantaged because of economic or language barriers:
Both Hell’s Kitchen and Harlem 5 have significantly lower concentrations of free/reduced-lunch students than their surrounding districts, and Cobble Hill also has a smaller (but still measurable) difference. Most schools (save for Harlem 5) have low rates of ELL enrollment, both in absolute and district-relative terms.
Student Achievement
(Note: Certain data elements for different schools were not available, and no data are available for Hell’s Kitchen or Crown Heights. All data shown pertain to the 2014-15 term.)
Where state-level data is available, Success Academy schools tend to dramatically outperform their city and districts, with the strongest gains observed in math. This maintains across demographic groups, including traditionally underrepresented/disadvantaged students:
Figure 4 provides the district comparisons for third grade students:
Bronx 2 is the only school with available (albeit limited) data on ELL students are; as expected, proficiency rates are higher for ELL students in Success schools.
In addition to state/district comparisons, it is important to examine whether Success closes achievement gaps within its own walls. In terms of economic disparities (the only comparison for which we had sufficient data), it seems that this is what Success does:
In Cobble Hill, disadvantaged students outperform non-disadvantaged students. Due to lack of data, we do not know whether this trend continues beyond 3rd grade. Recall that in our sample, Cobble Hill has the lowest FRL concentration and second-lowest ELL concentration.
Success students perform highly, but why they exhibit this performance is beyond the scope of this data. Selection effects, attrition, or other factors could account for this; it is also possible that the quality of the schools is the dominant reason for the observed differences. We realize that proficiency rates are only one measure of attainment, which does not reveal more-detailed score distributions.
Data on student attainment beyond the Success chain are difficult to find. Diane Ravitch reblogged an article from the NY Post telling that very few Success students have gotten into the most-selective NYC public high schools: 0 in 2014, 0 in 2015, and 6 in 2016. It is possible, as Moskowitz alleges, that the low rate of acceptance is due to the fact that students are not coached for these exams (Ravitch, 2016). It is also possible that the apparent performance of Success students is exaggerated while they are in the charter system.
School Discipline
Success Academy is renowned for its students’ high achievement. While its website makes no mention of a no-excuses policy, it emphasizes the importance of maintaining high standards and personal responsibility. Moskowitz has continuously spoken about her support of the use of suspensions and other common “no-excuses” strategies such as the enforcement of uniforms (Feldman, 2017). According to SUNY-CSI, Success instructors do not accept even minor forms of misbehavior, an approach which bears semblance to the broken-windows ideology behind no-excuses models (Charter Schools Institute, 2011). Still, in 2016 the organization’s Chief Academic Officer Michele Caracappa spoke out against the no-excuses label:
In contrast, our analysis of racially disproportionate discipline in randomly selected schools reveal Success’ higher rates of out-of-school suspensions than the surrounding district:
It is important to note that district schools tend to discipline a higher proportion of the students using in-school-suspensions. The charter schools did not practice in-school suspension (click here for our work on discipline demographics). The network has been attacked for refuting the findings of the U.S. DOE declaring these practices discriminatory. Success Academy has been found to suspend seven times more students than district schools that serve the same age group (Casey, 2015). We were unable to find raw data on arrests or violent crimes occurring in Success schools.
Their discipline model has also continued to fall under scrutiny. One of the most notable episodes occurred when a math teacher was recorded screaming at a first-grader who failed to answer a question during class (Taylor, 2016 Feb.). The network was also criticized after the New York Times found documents revealing a “Got to Go” list of students that the administrators of a Success school thought were detrimental to school quality. The parents of some students on the list mentioned that administrators had told them repeatedly that the school was not a good fit for the children (Taylor, 2015 Oct.).
Consistent with the “Got to Go” list, there is consistent evidence of attrition between grades 3 and 5:
These data reinforce the idea that charter schools are successful because they can choose their students. We saw the high levels of out-of-school suspension that Success Academy practices (Fig. 6), which along with practices that make parents or students unwelcome could explain the lower number of students in subsequent grades. These data suggest that the schools are making sure to only have children who comply with the organization’ model of teaching and discipline which, leading many families to opt out of the schools. Contrary to public district schools, which cannot choose the students they serve, charter schools could improve their scores and discipline compliance by literally ostracizing kids from their schools.
Marketing & Media
Success Academy prioritizes two standards of their schools on their website, which is their main source of marketing: student success, and accessibility to all students interested. In the section titled “Who We Are” their performance, rigor, and credibility is prioritized. This section states that they are “ the largest and highest-performing free, public charter school network in New York City”, and also that enrollment is open to all students. Enrollment statistics for historically disadvantaged, under-supported groups— such as low-income students, current and former English Language Learners, current and former special needs student and students of color—are made easily available.
The network is attempting to demonstrate a dedication to high performance, accessibility and inclusion by including this information in an extremely visible, accessible portion of the website. In the growing market of charter schools, networks often market themselves to a specific audience of parents and students. Wilson and Carlsen examined differences in marketing techniques by different charter schools, categorizing schools by the groups their marketing targeted. Success Academy fits the parameters of the “Progress Oriented” category, defined by Wilson and Carlsen as having an emphasis on achievement, “group-based instructional strategies”, and “coherent school culture”. This targeted marketing understandably affects the student population that chooses to pursue enrollments (Wilson & Carlsen, 2016).
Their mission statement echoes these goals, stating their goal to “Build exceptional, world-class public schools that provide children from all backgrounds can succeed in college and life…” the graphics below demonstrate the most used words in their “About” section, which highlights their marketing focus on academics and diversity in curriculum, as well as focus on rigor and outcomes by using words such as “scholars” and “achievements”.
Accountability and Oversight
NYC Comptroller Scott Stringer released an audit report of Success Academy from fiscal years 2013 to 2015, noting “serious concerns” about the network’s insufficient fiscal oversight. One of the audit’s most salient findings was an overcharge of $51,000 for special education services to the NYC Department of Education, but no evidence that Success Academy actually provided those services to students. The report also criticizes the network for unreported expenditures and improper loan documentation (Stringer, 2016).
In response to the Comptroller’s Office, Success denounced the audit as an empty political ambush (Harris, 2016). Instead of reacting bitterly to the audit report, however, the charter network may have drawn less scrutiny if it simply acknowledged the financial irregularities and made the appropriate repayments without fanfare. At the same time, the Comptroller’s Office may have exaggerated the significance of its findings. Although Success Academy should be held accountable for taxpayer dollars, the report did not find any evidence of fraud or criminal behavior, and poor record keeping does not necessarily imply darker motivations. Additionally, the magnitude of the fiscal mismanagement in question is relatively small compared to the network’s multimillion-dollar budget. The audit’s findings provide little reason to believe that these instances of fiscal mismanagement are systemic.
That said, Success Academy should accept and respect the Comptroller’s audit and simply work to make accountability an even higher priority in the future. One way in which the network can begin improving accountability is by sharing more details about the formal duties and practices of its Board of Directors. While biographies of board members are listed on Success Academy’s website, the board has yet to publicly disclose important information about CEO oversight, ethics and transparency, and board selection and self-assessment procedures (GuideStar, 2017). Sharing these details will ensure Success leadership is fulfilling its legal and fiduciary obligations to the network’s students.
Funding
A mixture of public and philanthropic dollars funds Success Academy schools. In 2014 the network earned nearly $42.5 million in revenue, consisting primarily of contributions, grants, and funding from New York for the operations of its schools. In the same fiscal year, 63% of the network’s revenue paid for program services directly benefiting students. The remainder went toward administrative costs and fundraising expenses. The sources of these 37% in overhead costs are unclear, but the network’s Form 990s reveal that top executives receive hundreds of thousands of dollars in annual compensation plus bonuses. The network earned a net profit of $9.25 million (GuideStar, 2017).
The fact that over one-third of Success Academy’s revenue goes to overhead costs instead of student programs raises skepticism in light of its most recent skirmish with New York City Mayor Bill de Blasio. Moskowitz refused to sign a contract with a city that entitled them to $720,000 in funding for the network’s pre-kindergarten program because she believed the contract would have given the city too much oversight (Taylor, 2016). But the network’s outrage over the forgone $720,000 seems unwarranted given its millions of dollars in remaining revenue after subtracting current program costs. Using its existing funds to keep the pre-K program afloat would not place much of a financial burden on the network, which raises questions about ulterior fiscal motives Success may have had in this most recent feud with the city.
Private donations are solicited in order to build new schools. For example, hedge fund billionaires Julian H. Robinson and John Paulson collectively gifted $33.5 million to Success in the past two years, which Moskowitz says will help the network expand to 100 schools by 2024 (Taylor, 2016). Many pro-Success hedge fund managers like Paulson also actively support the Trump administration, which explicitly endorses choice policies such as charter schools, vouchers, and magnet schools. Hedge Clippers released an incisive report condemning Success Academy for accepting major gifts from hedge fund board members who support conservative social and economic policies that harm the disadvantaged populations that Success intends to serve. The report identifies several managers and their spouses who are tied to the charter network, several of whom presumably champion school choice and other conservative education policies on the Trump administration’s policy agenda (Hedge Clippers, 2015). It is unclear whose interests these private philanthropic donors have in mind.
Staffing
Success Academy teachers receive “extensive professional development from experienced teachers and talented school leaders” according to Success’ website. A position called “Associate Teacher” is used as a stepping stone to a “Lead Teacher” position. Associate teachers are supposed to receive more support from their peers and professional development on their way to a Lead position. Many of the new teachers are recent graduates. There are mixed reviews from former Success teachers who held many different positions. Some past teachers praise the network’s support and professional development, while others criticize the high-stress and demanding environment (“Reviews”, 2016). It is unclear if this variance stems from differences in specific Success schools, or differences in positions. There have also been high turnover rates reported at many Success schools, as high as 50% at several. The transparency and interpretation of this data has not been straightforward, as Success Academy representatives have pushed back, stating that these numbers are inflated due to intra-network transfers counted as teacher resignations. Critics have cited New York Department of Education statistics which show overall retention rates below 70%, and same-school retention rates around 50% (Di Carlo, 2015).
Teacher diversity, or purported lack thereof, has been another publicized topic surrounding Success Academy. Cited statistics from the Teachers Diversity Committee of NYC showed that the percentage of white teachers at several Success schools during the 2013-14 school year was significantly higher than the district average of 58.6%, some seeing this number climb past 90% (“Success Academy Charter School Staff Diversity”).
Relationship to the District
Success Academy is often revered as a high-quality charter network where predominantly minority children in New York City have access to a challenging education that often puts them ahead of suburban schools. However, this praise is far from ubiquitous. Since entering office, NYC Mayor Bill de Blasio has opposed Moskowitz’s commitment to expanding charters because he believes networks like Success siphon off money from district schools. (Bergner, 2014). While some Success Academy parents believe the network is preparing their children for the future better than their traditional public schools, others resent the levels of discipline in the school and began looking for other options for the following year (Spear, 2015). In an extreme case of communal distrust, this past March a Success school co-located with M.S. 145, a NYC school in danger of being closed. M.S. 145 was promised three years to turn itself around, but Success Academy had prematurely moved into the space, creating tensions with the neighborhood community. There is suspicion that the charter network has greater sway in the decision to close M.S. 145 and plans to remain there once M.S. 145 closes (Vinopal, 2017). Despite these problems, however, there are signs that the charter is certainly trying to collaborate with educators in traditional public schools. According to the NYC Charter School Center, Success Academy hosted a professional development workshop for educators across the city to discuss best pedagogical practices (Reinish, 2015).
Conclusion
Success Academy sells itself as a mission-driven organization dedicated to the success of all students and improvement of pedagogy. Scholarliness and accessibility are its most prominently stated goals, and it supplies that 93% of its students are of color. State data reveal superior performance in Success schools in the youngest grades, and we expect nothing different for higher ones. As the network stands today it has had a net positive impact on public education for NYC students and families, even in spite of criticism of its discipline policy that echoes other charter networks’ “no excuses” philosophy. That said this criticism leads us to question whether Success Academy’s laser-like focus on academic excellence comes at the expense of other student outcomes, such as their socio-emotional and behavioral health. More data on how students fare beyond Success Academy are needed to evaluate this claim.
Furthermore, we demand greater transparency from the network before supporting their expansion to 100 schools by 2024. Even our brief examination shows high variability in FRL enrollment, deficits (some minor) in ELL enrollment, and high rates of suspension. Success touts the quality of its teachers and professional development, but it may harbor unhealthy, detrimental professional environments. Different individuals and offices have attested or probed claims that Success denies opportunity to all students and makes unfair use of public funding; Success officials staunchly deny this. We believe that the Success Academy’s growth must be accompanied by increased public accountability to ensure that all NYC district students have fair and equal access to its opportunities for academic enrichment, as well as to ensure that the network is not abusing public funding that traditional public schools unquestionably need.
Wilson, T. S., & Carlsen, R. L. (2016). School marketing as a sorting mechanism: A critical discourse analysis of charter school websites. Peabody Journal of Education, 91(1), 24-46.
Charter Management Organization: STRIVE Preparatory Schools (Denver, CO)
Julie Zhu, Lucas Riccardi, Momo Chapa, Caroline Francisco
Introduction
STRIVE Preparatory Schools is a charter management organization (CMO) comprised of eleven elementary, middle, and high schools in Denver, Colorado. They serve the communities of Far Northeast Denver, Northwest Denver and Southwest Denver, providing free public charter school education to approximately 3500 students in the Denver Public Schools (DPS) district. (“Our Leadership”, 2017) This report provides a comprehensive review of STRIVE’s educational and operational practices, so as to evaluate whether it fulfills its mission of providing quality education to Denver students. Ultimately, it finds that STRIVE shows promise in meeting its purpose, though it has not yet fulfilled it entirely. We argue then, that STRIVE should focus its energy and resources in strengthening its current schools rather than expanding its network further.
Research Method
In order to evaluate data from STRIVE, we conducted a random drawing of six of STRIVE’s eleven schools using an online random number generator. We then compared federal, state and individualized data for these six STRIVE schools with data for DPS, the school district geographically surrounding them.
STRIVE History, Pedagogy and Mission
The first STRIVE Campus was founded ten years ago by Chris Gibbons in Southwest Denver under the belief that “students from all backgrounds deserve a college preparatory education regardless of race, economic circumstance or previous academic achievement.” (“About Us”, 2017) The name STRIVE is an acronym of the school’s core values: Scholarship, Teamwork, Respect, Intelligence, Virtue and Effort.
Since its founding, this charter management organization has expanded to eleven schools, and is planning to expand to seventeen schools by 2022. This expansion has been largely funded through a $6.77 million federal grant STRIVE received in 2015 from the U.S. Department of Education’s Charter School Program (CSP), which is part of a federal effort to grow the number of “high-quality charter schools around the country.” (Neil, 2015)
STRIVE’s pedagogy is focused on college preparation; striving to make college prep the norm and something that can happen close to home. As the word cloud (Figure 4) shows, the word “College” is one of the most frequent words used when selling the school. In addition, it seems that STRIVE is also attempting to incorporate more bilingual education and hire bilingual staff. They recently added a Bilingual Campus Outreach and Engagement Manager and a Middle School Bilingual Science Teacher to their faculty. (“Middle School Bilingual Science Teacher”, 2016; “Bilingual Campus Outreach and Engagement Manager” 2017)
STRIVE’s mission is to ensure all students have an opportunity to access high-quality college-preparatory education, which is a mission they have yet to achieve completely. Although they do serve a disproportionately high number of students of color, they do not necessarily have higher or even on par student achievement in comparison to the the surrounding district schools.
This charter management organization is led by its founder and CEO, Chris Gibbons, a group of school principals, a Board of Trustees, and a Family Council from each school. The Board is comprised of people ranging from the Executive Director of the Carson Foundation, to a partner at a government consulting firm, to an officer at Teach for America, to two involved parent council representatives. (“Our Leadership”, 2017). The Family Council is comprised of the principal, at least one teacher at the school, and at least four parents or guardians of enrolled students, and one community member who does not have a student enrolled or is an employee of the school (“Our Leadership”, 2017). From this structure it seems that STRIVE is attempting to bring community members into decision-making bodies, but more research is needed to know if the voices from the top to the bottom are being heard.
School Demographics
The demographics of STRIVE schools are not representative of those of the entire Denver County School district. The racial makeup of the district is roughly 22% White, 56% Hispanic/Latino, 13% Black and 3% Asian. However, all STRIVE schools enroll student populations that are at least 90% Hispanic/Latino. The largest racial group outside of this racial majority exists at Excel, where 8 Black students are enrolled in a total school population of 238 (3.36%). It is important to note that the district’s racial statistics are not reported on a neighborhood basis. Seeing as STRIVE schools only exist within two areas of Denver – both of which are heavily populated with Hispanic/Latino residents – it is possible that schools in this network have a similar racial makeup to the neighborhood schools within Northwest and Southwest Denver.
Figure 1.
Such distortions exist within the charter network’s other demographics as compared to district data, namely the number of students who received free & reduced lunch and English-language learners. 89% of STRIVE students receive free or reduced lunch, while 70% of students within Denver County Schools receive this service. There is a higher proportion of English-language learners (ELLs) within the STRIVE network — as high as 92% at Smart Academy — than there is at the district level (33%). Each STRIVE school enrolls roughly the same proportion of special education students as the entire district does — within the range of 10.67% to 17.21% (district average 10.65%).
Figure 2.
Student Achievement
Students in Colorado take PARCC ELA and Math assessments as part of the Colorado Measures for Academic Success (CMAS). Based on this metric of academic achievement, STRIVE schools generally report lower levels of proficiency in English Language Arts and Math when compared to the Denver Public School district as a whole (Fig. 3.) STRIVE schools’ math scores are generally higher than their ELA scores. STRIVE Federal is an exception, showing higher ELA scores than the district in both 2015 and 2016. With some STRIVE schools reporting ELA proficiency as low as 11.5% and math proficiency as low as 15.2%, STRIVE’s mission to academically prepare all students for college is not being achieved. Looking at college acceptance, another measure of student achievement, 90% of STRIVE seniors were accepted to a four-year college in 2015 (Gibbons, 2015, pg. 9). Further studies should explore college-preparedness and college graduation rates of STRIVE students. In sum, STRIVE test scores are below the district average, with some exceptions. While these test scores are only one facet of assessing student learning, they signal that STRIVE needs to improve.
Figures 3a and 3b.
School Discipline
STRIVE schools vary in their school discipline cultures. In-school suspension data shows that some schools in the network (Lake, Federal, and Westwood) have not suspended any students in 2013. Meanwhile, some schools have similar or much higher suspension rates than the district average (2.85%). Excel (11.76%) and Smart Academy (10.25%) suspend students much more frequently than at the district level, while Sunnyside suspends students at roughly the same rate (3.43%). The heavily-skewed racial composition of each school makes it difficult to argue race plays a significant role in discipline. For example, the 40% of Black students who have been suspended at Excel refers to only 4 students, while the 9% of Hispanic/Latino students who have been suspended at Excel refers to 10 students (Fig. 4). School arrest data is consistent among the district, whereby no school arrests have occurred within the STRIVE network or any school in Denver County.
Figure 4.
Marketing & Media
STRIVE makes an evident priority of disseminating polished and accessible marketing materials. The school website features sleek and colorful graphic design with easily navigable tabs, high-quality promotional videos, and all materials available in Spanish (which is important considering the school’s high Latino population). Interestingly, although STRIVE is repeatedly classified as a “no-excuses charter” by outside sources (Quinlan, 2016; Gorski, 2014), the school never identifies itself in this way, nor does it feature images commonly associated with the term. Videos showcase students at work, laughing with one another, and fist-bumping teachers in hallways. And while these interactions seem to be entirely genuine, they are in contrast to other reports of STRIVE’s policies such as “students speak quietly or not at all,” negative marks for a water bottle on a desk instead of the floor, and reprimanding an incorrect action by having the entire class perform the correct action (Quinlan, 2016). Rather than “no excuses,” STRIVE’s marketing seem to focus on ‘high expectations.’
STRIVE’s pitch to parents is a two-part promise: that their children will be safe, and that after STRIVE they can and will attend college. While this approach is not necessarily the most inclusive, it allows parents to select STRIVE with a very specific end-goal in mind. STRIVE’s news presence is mixed. More critical reporting highlights its discipline (Quinlan, 2016), test scores and rapid teacher-turnover rate (Gorski, 2014), and tensions with public schools (see ‘Relationship to District’ section below). Other reporting offers high praise for mentorship programs, successful alumni, and students mobilizing action after the Trump election (“STRIVE Prep in the News”, 2017).
STRIVE has also been open about its dedication to protecting students and teachers regardless of their immigration or legal status. Through Obama’s Deferred Action for Childhood Arrivals (DACA) program, Colorado schools can hire Teach for America corps members who have been granted temporary resident status. Although STRIVE and DPS have both received backlash for several undocumented TFA teachers they have hired, they defend their decision by showing how these teachers are positive forces in the school community, especially as role models for students and their families who may also be immigrants or undocumented (Caldwell, 2014).
Figure 5. Word cloud of “The STRIVE Prep Promise” where word size indicates frequency. Notice the prevalence of “college” and “prep.” (“Why STRIVE Prep” 2017) Generated with wordle.net.
Accountability and Oversight
STRIVE’s accessible website makes it easy to view the CMO’s financial history, annual impact reports, and board proceedings. (“Accountability”, 2017) Budgets are available from 2009 to present and describe both the source and allocation of funds, as well as teachers’ salaries and benefits. Apart from controversies surrounding some of its donors, most notably the Walton Family Foundation (see ‘Funding’ section, below), STRIVE itself has never been involved in any scandals, financial or otherwise.
The DPS Board of Education is responsible for the changing tide in policy to embrace charter growth, but has been criticized for its accountability in implementing school choice. In 2011 DPS paid a New York-based consulting firm to design its new school choice system; although Denver parents were initially optimistic about the new system, they ultimately found it to be stressful, confusing, and less rooted in their “choice” than they were made to believe. (Robles, 2011) This finding is consistent with one of the most fundamental critiques of charters, which is that they spend public money on outsourced private services that do not serve the public.
Funding
The STRIVE network is funded by public and private sources, which are published in its annual impact report. Foundations are the main source of private funding, with the Charter School Growth Fund, Daniels Fund, and Walton Family Foundation as the top supporters, giving $500,000 or more to STRIVE in 2015 (Gibbons, 2015, p. 15). The Charter School Growth Fund (CSGF), based in Broomfield Colorado, specializes in scaling up charter schools it deems successful, while the other two foundations are general philanthropic ventures. Notably, CSGF and the Walton Family Foundation see school choice as a priority for improving American public education. The STRIVE network promotes the benefits of school choice, and sees increasing access to quality school options as part of its mission. STRIVE claims, “authentic choice for ALL families is critical to achieving equity.” (Gibbons, 2015, pg. 6). Critics of the Walton Family Foundation point to the privatizing effects of the school choice movement that amplify the voices of billionaires in matters of public education. The Waltons had a hand in funding 20% of the charter schools that opened in 2015, which makes it hard to deny that they have an immense influence on the charter sector as a whole- its goals, measures of success, and importantly, how big it is (Strauss, 2016). As a growing charter network receiving funds from GCSF and the Walton Foundation, STRIVE seems aligned to some degree with the school choice movement.
Staffing
STRIVE aims to “attract, recruit and retain exceptional talent” and to “engage in a culturally-responsive community” (“Join Our Team” 2017). These goals are reflected in the staff: 80% of STRIVE staff are returning staff, 50% are Spanish speakers, and 20% are first generation college students. The stat that 80% of staff are returning implies lower teacher turnover than probably exists because staff includes central office employees. Furthermore, when STRIVE saw a dip in test scores in 2014, teacher turnover was cited as one of the explanations (Gorski 2014). Teach for America certainly has a relationship with STRIVE, as Crystal Rountree, a Teach for America executive, sits on STRIVE’s board (“Our Leadership” 2017). STRIVE not only recruits teachers and administrators, but also trains them. The STRIVE network has a teacher residency program that trains teachers in STRIVE schools. Additionally, teachers at STRIVE can participate in the Principal Fellows program to train to become school administrators. The network emphasizes professional development and growth for teachers (“Join Our Team” 2017).
Relationship to the District
STRIVE has a complicated relationship with the surrounding district, DPS. The DPS Board of Education, headed by Superintendent Tom Boasberg, has been responsible for the shift to embrace school choice and charter growth in Denver, and the board’s support for Boasberg’s proposed reforms has increased from 3-4 to 6-1. (Torres, 2013) Yet those loyal to public schools within the district have expressed feelings of disenfranchisement, both financial and political. Charter growth in Denver meant increased options for families, but it also meant a new charter could become a zoned neighborhood’s ‘default’ and admission into a traditional public school was no longer guaranteed. (Friedman, 2015)
As STRIVE expanded, DPS implemented a series of forced co-locations that housed the growing charter in the same buildings as existing public schools rather than building new sites. Olivia Friedman, a high-schooler at public North High School which was forced to cohabitate with STRIVE, wrote in a Denver Post op-ed: “It would mean we would be required to share the cafeteria, the library, and other facilities. Many believed it would disrupt North’s positive growth that had been occurring in recent years. Above all, it would be sending a clear message to the North students and community: We aren’t good enough. A traditional high school education isn’t good enough.” (Friedman, 2015)
Conclusion
Throughout the last decade, STRIVE has expanded drastically from one to eleven schools in the charter management organization. However, could this be a case of “replicating failure” expansion? (Zernike, 2016) Based on the controversy with school discipline, the high turnover rates of teachers in years of expansion, the low levels of student achievement, tensions with neighboring public schools, and other issues, we argue that this CMO is doing just that. STRIVE has shown promise in serving its community by offering bilingual education and helping students get to college, but the network’s weaknesses demand attention. Therefore, before STRIVE continues expanding to other schools, we suggest they should invest heavily in combatting the issues mentioned in this report to make sure they are replicating success and quality education.
Works Cited
Buckley, P., Ph.D., & Muraskin, L., Ph.D. (2009). Graduates of DPS: College Access and Success (pp. 1-45, Rep.). The Piton Foundation, The Pell Institute for the Study of Opportunity in Higher Education.
Rocketship Schools: Taking Steps Towards Closing the Achievement Gap
Layla Treuhaft-Ali, Emil Friedman, Lindsay Efflant, Jake Fender
1) Introduction
Similar to other rapidly-growing charter management organizations (CMOs), Rocketship is a relatively new player in the education space, primarily targeting lower-income, minority students in urban areas. The main pedagogical innovation that distinguishes Rocketship is the use of “blended learning”: students participate in whole-group instruction, small group lessons, and spend 80-100 minutes each day in a “Learning Lab” where they practice skills on computers and work with tutors. Rocketship leaders claim that this strategy allows them to personalize education to meet each child’s unique needs, but Rocketship still faces criticism that this method is impersonal and relies too heavily on screen time.
Early data points are promising: Rocketship schools have low suspension and expulsion rates, and high academic growth scores. Although some CMOs have been criticized for self-selecting students unrepresentative of the overall communities in which they live (Frankenberg and Siegel-Hawley 2013), Rocketship generally still serves populations similar to its surrounding public school districts. By exploring, amid some criticism, various techniques in terms of pedagogy, discipline, and community engagement that a typical public school would be unable to pursue, Rocketship shows promising steps in becoming a responsible CMO that could play a healthy role alongside traditional public schools in urban centers.
Demographics, Achievement, and Discipline Methodology
We selected six schools for data investigation using a random number generator. We obtained federal, state, and district information on demographics, discipline, and achievement using the databases offered by the National Center for Education Statistics and the Department of Education’s Office of Civil Rights. Although we had some difficulty in some categories because data had not yet been published for recently-opened Rocketship schools, we were able to successfully find most data points needed.
2) History, Pedagogy, and Mission
While the crux of Rocketship’s published mission — creating alternative, high-quality education choices for vulnerable students — is credited to Father Mateo Sheedy, pastor of San Jose’s Sacred Heart Parish, who in 1999 began questioning the low performance rates of students in his parish, Rocketship began in earnest in 2006, when Father Sheedy’s congregation set off to pursue his mission of improving outcomes for students in San Jose alongside John Danner and Preston Smith. Danner and Smith, both young, energetic, and decidedly entrepreneurial, wanted to bring technology and community engagement to the forefront of the movement they intended to create (Rocketship Schools 2017a). They also, in contrast with founders of most other CMOs, wanted to focus on elementary education, figuring that students exposed to a high-quality education early may do better post-graduation in traditional schools (Ableidinger & Barrett 2013).
Soon after their first school, Rocketship Mateo Sheedy Elementary, opened, its waiting list grew to the point that Danner and Smith knew Rocketship was ripe to expand. During Rocketship’s next ten years, it opened an additional fifteen schools, mostly in San Jose but also with locations in Nashville, Milwaukee, and Washington, D.C. Rocketship originally aimed to serve one million students by 2020, but has since reduced its goal to 25,000 students by 2017 (Bernatek et al. 2012).
Through its mission to “eliminate the achievement gap in our lifetime,” Rocketship targets minority, low-income, urban students in tandem with a particular interest in engaging these students’ parents as well (Rocketship Schools 2017a).
3) School Demographics
We considered an objective data analysis to be important in determining that Rocketship acts as a responsible CMO in serving a broad cross-section of students. For our analysis, we investigated six Rocketship schools: Discovery Prep, Fuerza Community Prep, Si Se Puerde Academy, Spark Academy, Nashville Northeast Elementary, and Southside Community Prep.
(Figure 1)
Confirming Rocketship’s claimed interest in “eliminating the achievement gap in our lifetime,” it is not surprising that its student bodies are typically more disadvantaged than their districts’ overall populations. Based on our data, Rocketship’s student population is high-poverty: more than three-quarters of students are on free or reduced lunch (FRL) at every school. This is especially significant in the San Jose school district, where FRL students are a minority in the district as a whole (Figure 1).
(Figure 2)
Unsurprisingly, high minority populations in Rocketship schools coincide with socioeconomic disadvantage. Overall, 95% of Rocketship students are students of color. In the Bay Area and Milwaukee schools, student bodies are majority Hispanic; Nashville Northeast Elementary was the only school with a large African-American population (Figure 2). This seems in line with Rocketship’s responsibly serving the communities in which it has schools.
(Figure 3)
Perhaps starker than socioeconomic and racial representation, in Rocketship schools across every region, English Language Learners are represented at between two and four times the rate of their representation in the district overall (Figure 3). One reason for this may be Rocketship’s “blended learning” strategy: students spend about two hours a day in a “learning lab” where they work individually with tutors, small teams of their peers, and online programs. This “personalized learning” time may be especially beneficial for English Language Learners, who can use the time to build language skills or work on academic content at their own speed.
(Figure 4)
Unlike the other three categories we analyzed, special education students are underrepresented at Rocketship schools, especially at Fuerza Community Prep in San Jose and Southside Community Prep in Milwaukee (Figure 4). This is somewhat surprising, since it seems that Rocketship’s individualized learning model would be well-adapted to working with students with special needs. However, limited resources may account for this discrepancy, raising questions with respect to Rocketship’s role in a public school district and offering one counter-narrative to Rocketship’s otherwise fairly-equitable, fairly-responsible nature (National Center for Education Statistics).
4) Student Achievement
In conjunction with its largely-vulnerable student body, Rocketship shows great interest in its low attrition rates; last year, 90% of Rocketeers chose to stay with Rocketship despite each having a district spot available to them. In terms of assessment, Rocketship uses standardized tests, such as Northwest Evaluation Association’s Measured Academic Progress test (NWEA MAP), in the fall, winter, and the spring, to determine both how their students’ proficiency matches up to that of students from similar socioeconomic backgrounds in district schools, and also to measure how their students’ performance is changing over time (Rocketship Schools 2017b).
Comparison to public school counterparts
Rocketship students do quite well compared to their counterparts in the public school system. In the 2015-2016 school year, Rocketship students overall outperformed their counterparts at impressive rates: in the third grade, 83% of math scores and 59% of language arts scores were above public school counterparts, in the fourth grade, 100% of math scores and 88% of language arts scores were above (public school counterparts), and in the fifth grade, 100% of math scores and 60% of language arts scores were above those of the students’ public school counterparts (Kamenetz 2016). In general, Rocketship saw standardized test scores parallel to or slightly higher than those of their schools’ states overall as well (National Center for Education Statistics 2016).
Particularly impressive is a ranking of top-performing Bay Area schools, where Rocketship locations are most concentrated, for low-income Latino students in mathematics. In the report, of the eighteen schools listed, six of them belong to the Rocketship network (Innovate Public Schools 2016).
Student growth
Tracking 1,300 students’ achievement on the NWEA MAP test from the fall of 2012 to the spring of 2016 shows that the percentage of students performing at or above grade level in math went from 34 to 62% (a 28% increase), and that the percentage of students performing at or above grade level in reading went from 25 to 56% (a 31% increase). These figures are significant because they show how a student’s contact with a Rocketship school is changing their achievement from what it would have been had the student remained in a district school. The average first year growth, as measured by students’ tracked performance on the MAP test, is 1.53 years of growth in mathematics and 1.39 years of growth in reading (Rocketship Schools 2016a). We view this as a strong indicator that Rocketship is responsibly serving its communities.
5) Discipline
Perhaps in line with its interest in academic growth, Rocketship claims to be dedicated to keeping students in class; their 2015-2016 Year in Review report has an entire subheading entitled, literally, “Keeping Kids in Class,” and the good news is that Rocketship largely seem to be doing that. In the 2015-2016 school year, they had a 2.6% suspension rate, and in each school we analyzed, the school’s suspension rate, both in total and disaggregated by race, was lower than its district counterpart, and in many cases was zero (Department of Education: Office of Civil Rights 2016). In addition, no school in Rocketship’s entire history has ever expelled a student (Rocketship Schools 2016a). Interestingly, Rocketship offers very little literature regarding disciplinary practices on its official website, raising questions with respect to transparency.
(Figure 5)
The one Rocketship school we examined, Southside Community Prep, whose suspension rate was higher than zero shows clearly a difference between its rates and those of its surrounding district (Figure 5).
6) Media and Marketing
Unsurprisingly, given its demographics, Rocketship marketing items themselves take a social-justice-oriented look at education, discussing often “achievement gaps” and “low-income students,” with branding similar to that of a technology start-up. Most multimedia features minority students, and the website is available in 100 languages, suggesting that Rocketship makes few attempts to subtly select for wealthier, whiter students (Rocketship Schools 2017a).
In this typical marketing video, for example, Rocketship emphasizes its personalized learning techniques and rapid growth model as a strategy for rapidly ending the achievement gap, particularly among low-income and minority students (Rocketship Schools 2013).
Major media coverage of Rocketship schools includes a segment on “Learning Matters,” part of PBS NewsHour produced by Education Week. Although the segment offered considerable praise, in terms of criticism, the segment argues that the Learning Labs don’t work, and shows shots of students looking disengaged from their computer learning activities (PBS NewsHour 2013).
NPR also covered Rocketship in a more negative light this year in a widely-read profile. Its report accuses Rocketship of maintaining far too low a staff-student ratio: at one Rocketship school, six full-time teachers served 630 students. Aides filled in the gaps: individualized tutors reported monitoring between sixty and ninety students alone during Learning Lab time. The article also criticizes Rocketship for having young children spend between 80 and 100 minutes in front of a computer each day, requiring several hours of silent time (called “Zone Zero”) each day, and refusing to let children go to the bathroom such that even older children wet themselves. Finally, the article suggests that Rocketship is too focused on test scores, to the point where teachers have students retake standardized tests in order to boost scores (Kamenetz 2016). It is fair to note, however, that these criticisms of Rocketship are common critiques of charter schools and CMOs in general as well.
7) Accountability and Oversight
In line with its “achievement gap”-oriented marketing narrative, Rocketship’s main method of accountability consists of measuring its students against those at other schools, mainly according to growth rather than proficiency. Rocketship graduates have been projected, according to NWEA MAP math and reading tests, to be equivalent to one year of growth ahead of their peers at other schools. Rocketship schools in California have been ranked in the top 10% in the state in math and ELA performance, while Rocketship Milwaukee is ranked number one in math and language arts performance, and Rocketship Nashville is in the top two in the city among all 73 public elementary schools (Rocketship Schools 2017b).
Additionally, Rocketship Schools uphold teacher and test-score accountability standards but are especially unique due to the importance they place on parental involvement. Rocketship Schools mandate that every family devote at least eighty hours of volunteering time per year to their child’s classroom. It is common to find parent volunteers working alongside teachers during classroom activities and field trips (Ableidinger & Barrett 2013).
Data with respect to funding between individual districts and Rocketship is not publicly available, and while Rocketship hasn’t yet encountered significant financial scandals, transparency still is limited.
8) Funding and Budget
Unlike its particular arrangements with individual district, Rocketship is transparent with overall funding sources. The Rocketship Schools budget is broken down as follows: 80% state funding, 11% federal funding, 8% philanthropy, and 1% “other local revenue.” Rocketship’s website lists the top 32 donors from 2015-2016 ranked by level of donation: $5,000 and above (11 donors), $25,000 and above (5 donors), $100,000 and above (11 donors), $500,000 and above (2 donors), and $1,000,000 and above (3 donors) (Rocketship Schools 2016b).
(Figure 6)
According to our analysis using Rocketship’s budget breakdown [1], we can calculate that the bare minimum state funding is $52,800,000, the bare minimum federal funding is $7,260,000, and the bare minimum “other local revenue” funding is $660,000. Perhaps most notable is how large the state funding component is. It is clear, then, that one of Rocketship’s main priorities as it grows ought to be maintaining responsible, mutually-beneficial relationships with states.
The donors listed on Rocketship’s website include mostly individual and collective venture capitalists and non-profit organizations. A fair amount of the donors (most of the nonprofits and a significant number of the individual venture capitalists) seem dedicated to education funding (the individual foundations often had a history of investment in educational ventures), but what was interesting was that some of the collective venture capital organizations (like Baird) don’t seem overly attached to education as a philanthropic end in and of itself (Rocketship Schools 2016b).
9) Staffing
Just as Rocketship is unafraid to accept funding from a diverse array of donors, it is similarly unafraid to source teachers from non-traditional teacher pathways. Indeed, 75% of Rocketship teachers come from Teach for America and about half have less than two years of teaching experience (PBS NewsHour 2013). Because of Teach for America’s generally temporary nature, it is clear that teacher longevity and loyalty is not considered a significant factor in Rocketship’s faculty development. One of the reasons that may account for this is Rocketship’s reliance on Learning Labs with personalized computer learning and untrained staff, meaning that students are already used to seeing variation each day in their teachers and caretakers. It would be fair to assume that the constantly-rotating nature of Rocketship faculty means that students interact with many different staff members during their years in a Rocketship school, and that each school has limited potential for mentorship for new teachers by veteran teachers.
Rocketship offers professional development to new teachers, including mentorship from administrators and more experienced teachers. 50% of a teacher’s salary is tied to students’ test scores (Kamenetz 2016). Teachers are not unionized, but they receive higher pay and benefits than average teachers in their districts. This works because of Rocketship’s Learning Lab model. The “individualized tutors” who mentor Rocketship students during Learning Lab time are hourly employees who are not certified teachers and can be paid at lower rates. This allows Rocketship to hire six fewer full-time teachers per school than they would otherwise, saving the organization $500,000, which is used to increase teacher pay and program funding (Rocketship Schools 2017).
10) Relationship to districts
Relationships with districts vary. Perhaps due to Rocketship’s unorthodox structure, in some Bay Area schools, there is a disconnect between families of Rocketship students and of non-Rocketship public schools and between the district and Rocketship itself. Among parents in the Bay Area, there has been an outcry of frustration that “the local school district has routinely targeted the school, students, and families with discriminatory language and action” (Gil 2017). The Mt. Diablo Unified School District, which contains the Rocketship Futuro Academy, has limited the school’s ability to provide the legally mandated space for serving food, which compromises the 80% of free-and-reduced-lunch students’ ability to receive their meals. Many parents see this, and the district’s reluctance to provide the school other proper physical spaces, as a personal attack (Gil 2017). In tandem, there is little evidence of significant collaboration between Rocketship and surrounding districts in terms of pedagogy and practice.
11) Conclusion
As a CMO, Rocketship operates a fairly sound, well-performing, equitable system. In terms of the purposes of education, Rocketship certainly contributes to the social mobility of lower-income students by typically offering higher academic growth rates than they would otherwise find in their district public schools. It also contributes to democratic equality, with the important exception of disabled students, whose Rocketship enrollment does not parallel surrounding schools. Nonetheless, Rocketship appears to be serving vulnerable students well, responsibly serving its communities with good achievement data to show for it. It would serve Rocketship well to continue to grow at a moderate, responsible pace.
(2495 words excluding headers and citations.)
Footnotes
[1] Funding and Budget Methodology
Each figure in the following budget analysis comes from Rocketship’s reporting of its own finances. The approach we used calculates the absolute bare minimum dollar values for each portion of the budget, based on Rocketship’s budget breakdown and its reporting of top donors and the amount categories they fell into.
The following is a calculation of what the absolute bare minimum Rocketship Education budget must be. It involves calculating what the bare minimum philanthropic portion of the budget is (based on the donations listed on the website), and then using that number to calculate the bare minimum total budget (based on the fact that we know that philanthropy comprised 8% of the total budget), and then finally using that estimation of the total budget to disaggregate the bare number of dollars that each portion must be composed of. The calculation is based on two assumptions: first, that a donor in the category “$___ and above” actually only gave the bare minimum to be included in that category, and second, that the donations beneath the levels listed on the website do not significantly impact the philanthropic portion of the budget. Thus, this is inevitably just an exercise to determine what the absolute bare minimum dollar value of each part of the budget is comprised of, and will be distant from the actual budget values, with an error directly related to how false the assumptions (especially the second) happen to be.
So, first, if we calculate the philanthropic portion, we will (based on the assumptions listed earlier) perform the following calculation for each group: number of donors in group * bare minimum needed to be in group, and we will add each of these together. Thus, we get $5,000(*11)+$25,000(*5)
+$100,000(*11)+$500,000(*2)+$1,000,000(*3), which equals $5,280,000. This (the bare minimum of 8% of the total budget) leads us to calculate that the bare minimum of the total budget amounts to $66 million. Then, based on Rocketship’s budget breakdown, we can calculate that the bare minimum state funding is $52,800,000, the bare minimum federal funding is $7,260,000, and the bare minimum “other local revenue” funding is $660,000 (Rocketship Schools 2016b).
Department of Education: Office of Civil Rights. 2016. “Civil Rights Data Collection.” Accessed March 10, 2017. http://ocrdata.ed.gov/.
Frankenberg, Erica and Genevieve Siegel-Hawley. 2013. “A Segregating Choice? An Overview of Charter School Policy, Enrollment Trends and Segregation.” Pp. 129-44 in Educational Delusions? How Choice Can Deepen Inequality and How to Make Schools Fair, edited by G. Orfield and E. Frankenberg. Berkeley, CA: University of California Press.
Edgar Aviña, Shoshana Davidoff-Gore, Caitlin Dermody, Daniel Vernick
Introduction
For years, politicians, educators, and parents alike have engaged in the great charter school debate. Functioning in the space between privatization and public funding, charter management organizations (CMOs) can be filled with mystery beyond the specifics of their structure. Recently, the American media has latched onto this fact, often using the stories of either a star student or a fraudulent CMO on their front page. However, only one CMO in the United States is connected to a self-exiled Turkish cleric, a coup d’etat, and a U.S. investigation—the Gulen charter schools network.
In this report, we formulate a brief account of Gulen Schools in America. Through the study of five specific Gulen schools and an overview of data collected on the Gulen movement, we study the organization of these schools, their educational practices, and their value for American students. We find that students in Gulen schools are outperforming their peers in public school districts, and, in spite of a less-than-transparent connection with Turkey and Fethullah Gulen, Gulen schools provide a completely secular education based on the advancement of STEM skills.
Methodology
There is no one source which comprehensively documents the demographic statistics, discipline trends, and tests scores of the Gulen Schools network as a whole. Therefore, it was necessary to randomly select Gulen schools to examine more carefully. To generate this list of five schools, we copied and pasted a comprehensive list of all Gulen linked schools (sourced from a blog called Charter School Scandals, curated by education blogger Sharon Higgins) into an Excel sheet which automatically assigns a number to each school (the first school is in row 1, and so on). We then used a random number generator to get five numbers, which we then cross-referenced with the Excel sheet to determine a list of five schools. To obtain the qualitative information for this report, we used online articles about the Gulen Schools Network as well as information from each school’s’ individual website. The quantitative data presented in this report was acquired from the databases of the federal Office of Civil Rights and US News and World Report.
History, Pedagogy, Mission of Gulen Schools
Gulen charter schools stem from a larger religious and political movement known as the Gulen Movement. The movement was started by Imam Fethullah Gulen, born and raised in Turkey, who has been an active religious leader since the 1960s and 70s. Gulen preaches from the Sunni tradition of Islam and encourages cooperation and tolerance, as well as the importance of a comprehensive secular education outside of religious teachings. Although the schools receive no direct oversight from Gulen himself, they were founded as an extension of hizmet, meaning “the service”, which is an alternate name for the movement as well as its primary principle. Providing an excellent education is seen as a fulfillment of service to others, and the schools emphasize math and science, with no religious indoctrination.
According to a website created and endorsed by the Gulen Movement, the first Gulen schools were established in Turkey to help students prepare for University in the late 1970s and early 1980s. In the early 90s, as the Soviet Union dissolved, businessmen and educators traveled to other nations in Central Asia to establish more schools. Today, there are Gulen schools and cultural centers on six continents that serve over 2 million students.
In the United States, there are currently 167 charter schools that are likely linked with the Gulen Movement in 26 states and Washington D.C, making it one of the largest charter school organizations in the country. (Due to the lack of explicit connections between the Gulen Movement and many of its charter schools, it is difficult to give a definitive number. Other sources claim that there are between 120 and 135 US Gulen Charters). In 2012, the schools enrolled more than 45,000 students, but the number has likely increased in the years since.
In practice, the Gulen movement seems to manifest most explicitly as an ideology- principles of public service and secular knowledge that inspire and guide supporters of Fethullah Gulen as they set up smaller CMOs in individual cities. In Texas, for example, the Gulen associated CMO is called Harmony Public Schools, which operates over fifty charter schools across the state. The CMO was founded by Turkish-American graduate student Dr. Soner Tarim, and the network does hire international (read Turkish) teachers, the CMO explicitly denies any religious affiliation. However, the Gulen associated schools in other parts of the country are run by separate CMOs, like Magnolia Public Schools in California, which have a completely different organizational system.
While there is an immense number of schools associated with the Gulen movement, most do not advertise an explicit connection, either on public internet sources or when asked directly. Looking at websites for many of these US charters, it would be impossible to detect the connection without prior knowledge. This is likely in-part to prevent increased Islamophobia that could be catalyzed by an explicit connection with Gulen and Turkey. Another possibility is that the schools are truly not connected with Fethullah Gulen himself, and thus do not have any reason to advertise themselves as such. Given this lack of transparency, it is also difficult to pinpoint pedagogy that is consistent between Gulen schools and each CMO. There is a clear focus on math and science in many of the schools, with an emphasis on technology and innovation, but each regional CMO has its own mission and vision.
Marketing
As previously mentioned, no Gulen school markets itself as an associate of the Gulen movement. The schools are run out of a variety of charter management organizations, including Magnolia in California, Harmony in Texas, Horizon Science Academy in Illinois , and Sonora in Arizona to name a few. Each charter network advertises their schools slightly differently on their website. Magnolia has an added focus on the “arts”, Harmony is committed to creating “safe environments”, and Sonoran schools emphasize “excellence.” However, all of the schools market themselves through one common mission: to support STEM, Science, Technology, Engineering and Math educations for today’s students. According to the charter’s websites, it is the study of these subjects that increases students success in “college, the workplace, and the 21st century.” Each website cites a desire to produce “global effects” or “world leaders” as a secondary goal of their schools’ missions. Despite no mention of “Gulen” on any of the webpages, the mission of these schools draws direct parallels to the teachings of Fettaluah Gulen, himself. Fettaluah Gulen has preached that “Studying physics, mathematics, and chemistry is worshipping God.” He also often emphasizes the path of a universal community around the globe.
Demographics
Although many teachers in Gulen schools are Turkish, Gulen Schools serve a wide variety of student populations. As shown by the graph to the right, they tend to either overpass or match the enrollment of students of color of their districts. Only the Harmony School of Advancement sports a lower rate of diversity than its district. Latinos are the largest ethnic group in the charter schools, but they are not present in any school at a rate higher than 70 percent (also note that five of the six are located in majority-Latino cities: Los Angeles, Houston, and San Antonio).
A comparison of the free and reduced lunch data of Gulen schools and their surrounding districts makes it clear that Gulen Schools are not serving the highest-poverty students in their areas, but that they are serving moderately needy students. In other words, Gulen schools are serving needy students, but not the most needy in their areas. This distinction is important, and it emerges from the fact that Gulen schools enroll much fewer free lunch students (The School of Science and Technology in San Antonio enrolls a whopping 50% less free lunch students) but also tend to serve more reduced lunch students than their surrounding districts, as shown in the graphs above. These differences illustrate how Gulen can rightfully claim that it is serving “low-income students” — reduced lunch students are still classified as such — while also, in effect, not serving the most high-need students (free lunch students).
School Districts
As mentioned above, the Gulen schools generally represents the demographics of their school district. When considering how the Gulen Schools affects the school district, one must understand that one of the largest complaints against CMOs is their use of funds taken from public schools. As one of the largest CMO networks in the country, this argument is often heightened. However, despite these usual claims, The largest impact on the surrounding district has often come through news stories about the schools questionable practices. For example, one teacher, Mary Addidi, was fired from her school in Cleveland, Ohio just to be replaced by a Turkish teacher. In 2014, the FBI examined 19 Gulen schools for “undisclosed reasons.” This did not come as a surprise too many. The schools are a direct way for the Gulen movement to (1) make money, (2) influence students, (3) connect with politicians, and (4) certify Turkish citizens immigration to America. For example, 152 state legislatures toured Turkey through funding from Gulen organizations from 2006 to 2015. Some claim that the profit of the Gulen schools, run through public funding, may have funded these trips.These schools are often considered to serve as profit creators and support suppliers for the Gulen movement. However, when perusing the Internet for examples of these fraudulent aspects, the success stories of Gulen students. There are two narratives that appear for Gulen schools: (1) an exploitation of academics for a illegal purpose and (2) highly performing schools where all students excel.
School Achievement
The cross-section of Gulen Schools that we have examined have consistently outperformed their home states, and drawn even with or outperformed their surrounding districts (No achievement data was found on three of the schools). As shown in the graphs on the previous page, Horizon Science Academy in Cleveland and the School of Science and Technology in San Antonio report test scores that are roughly equal with those of their surrounding district in math and reading. The two Harmony Schools in Houston and the Magnolia Academy in Los Angeles have outshone their respective districts in both math and reading. It is noteworthy that none of the schools are falling behind their respective district.
The Gulen schools consistently outperformed their surrounding states. What is particularly impressive is the performance of the School of Science and Technology in San Antonio, where the percent difference in student proficiency rates in math between the school and the state of Texas was a whopping 29%. What’s noteworthy about this set of graphs is that it shows that some Gulen schools have particular areas of strength. For example, the School of Science and Technology excelled in math, which makes sense in light of its name and mission. The Harmony School of Advancement, which has less of STEM focus than other schools in the network, did phenomenally in reading, but comparatively less well in math. Overall, the performance of the Gulen schools is satisfactory, although it is clear that some have more room for growth.
Discipline
Within Gulen Schools, Discipline often varies. There is variability in the rates of in-school suspension. Three of the six Gulen charter schools we studied had substantially higher suspension rates than the surrounding districts. One, Harmony Science Academy in Houston, sported a lower suspension rate than the surrounding Houston school district. Two Gulen charter schools in Los Angeles suspended not a single student; this low rate of suspensions may be rooted in a larger trend in Los Angeles which has seen a sharp drop in suspensions.
While the lack of suspensions in the Magnolia schools may very well be rooted in the wider downward trend of suspensions in Los Angeles, the root causes of the variability in the other schools is harder to discern. Harmony School of Advancement boasts of “Discipline with Character” that “reaffirms our strength as a drug free, gang-free, peer pressure-free, bully-free, truancy-free, fight-free and crime-free campus.” The Horizon Science Academy merely notes that it wants to “maintain an enriching, safe environment.” School of Science and Technology only notes that it wants to maintain a “dynamic” learning environment.
Funding
The FBI is currently investigating whether Gulen and his followers have taken funding from the charter schools “to fund his movement in Turkey.” One senior State Department official said Gulen schools and charities in America “look a lot like the ways in which organized crime sets itself up…to hide money for money laundering.” Former Gulen teachers say that there is a “scheme by Gulen’s followers to take advantage of the American charter school system and fund Gulen’s movement.” For instance, former Gulen follower and Gulen school math teacher Ersin Konkur said that the school administration made Turkish teachers give a portion of their salary back to the school. Konkur said, “they were asking for cash [from the teachers].” Konkur paid around 20,000 throughout his time as a teacher.
Mustafa Emanet, who works at a Gulen-linked school in Ohio, said that he had to give 40% of his salary back to the administration. The FBI thinks that administration at Emanet’s school “illegally paid themselves 5 million in federal contracts and then sent those US tax dollars to Bank Asya, a bank in Turkey linked to Gulen’s followers.” Alp Aslandogan, Gulen’s closest advisor, said that those allegations are completely false and that if teachers were forced to pay a portion of their salary, “Gulen would be the first to condemn it,” saying the investigation is politically motivated.
The Turkish government hired lawyers to encourage the Texas Education Agency (TEA) to investigate Harmony Public Schools, which is the largest Texas charter school network and a Gulen-linked CMO, serving 31,000 students in 46 schools across Texas. The Turkish government alleges that “Harmony hires under-qualified Turkish teachers” and directs “business toward companies run by Turkish nationals.” Harmony schools CEO Soner Tarim called the lawsuit “ridiculous and baseless,” and said that it’s a political attack by President Erdogan. TEA is currently assessing the complaint.
Funding for Gulen-linked charter districts varies depending on the CMO, but largely comes from a few central sources. Austin’s 2016-17 Harmony schools budget, for instance, received 32.9 million from the Foundation School Program, which is Texas’s main source of state education funding. Another 2 million came in federal funding distributed by the TEA, and smaller amounts include $719,000 from the National School Lunch Program and $125,000 from the National School Breakfast Program. Only $292,696 came from local tax revenue. Other schools had similar funding sources and revenue proportions.
Staffing
Gulen-linked charter districts offer similar descriptions of their teaching opportunities and work environment. Harmony Public Schools, for instance, encourages teachers to apply for a job for “personal growth and professional success,” and encourages “recent graduates or experienced professionals seeking new career opportunities” to apply. There is a clear emphasis on teachers new to the profession. This implies that Harmony seeks to mold teachers to their unique model, which emphasizes a math and science-based curriculum and a “culture of competition, discipline, and parental engagement.” Harmony’s emphasizes “opportunities for advancement [and] career growth” but fails to mention virtually anything about students. Salaries range from 20,000 for a teacher aide to 47,780 for a high school teacher to 74,001 for a software developer. The starting salary varies depending on the cost of living in the location of the school. Similarly, the Gulen-linked charter CMO called Magnolia Public Schools highlights the ability for teachers to “reach their full potential” and to “build and advance [their] career,” emphasizing personal careers but leaving out any discussion of the ability to make a difference in students’ lives.
A variety of staffing issues have arisen with various Gulen CMOs. Complaints from teacher unions in Illinois and Ohio accusing Gulen-linked CMOs of violating the visa program by favoring Turkish over American teachers have spurred a Department of Labor investigation. Three Los Angeles Magnolia charters are at risk of being shut down because they bring in teachers from Turkey, using temporary work visas. In 2016, the LA School Board noted that it was concerned that Magnolia schools applied for visas for 138 teachers, funding all their travel costs including $3000 per person visa costs for the teacher and their family members. Spending $929,000 of taxpayer dollars to import large numbers of teachers from Turkey, paired with the “failure to disclose the hiring strategy,” has aroused suspicion. Furthermore, the work visas the Turkish teachers had are only supposed to be used “when no qualified American job seekers can be found.” The hiring patterns at Magnolia schools were replicated in most of the 136 Gulen-linked schools across the country. Another complaint is that Magnolia didn’t “turn over all requested documentation.” The chair of LA School Board says that Magnolia never said told the school board that it would bring teachers from Turkey. Now that the school is up for reauthorization, school board head Steve Zimmerer says that Magnolia didn’t necessarily “follow the instructional and business practices outlined in its petition.” The Magnolia CEO said that those involved in the scandal should be brought to justice, but that the Magnolia schools shouldn’t close because doing so would punish students who did nothing wrong.
Accountability
Harmony schools are effective at teaching students, but their transparency and accountability to taxpayers and the American people must be improved. Many are highly-ranked in national ratings, and the waiting list is equivalent to the entire student body at all the Harmony schools. However, many controversies have recently arisen. A 2014 lawsuit accused Harmony Public Schools of paying male Turkish teachers more than female and non-Turkish teachers, even than those with more experience. In 2014, Harmony schools reached a settlement with the Education Department regarding teaching of ELL students and students with disabilities. An investigation found that there are far fewer of those students at Harmony schools than at public schools, and Harmony schools didn’t provide them with the appropriate support.
At Harmony and other Gulen schools, contracts and purchases from school lunches to teacher training are awarded to Turkish businesses. The vast majority of construction on Harmony schools has been done by Turkish companies, even though local American companies have bid hundreds of thousands of dollars lower in some cases. For instance, TDM Contracting was awarded an 8.2 million contract to build a new Harmony charter in San Antonio, despite the fact that the company was only 1 month old. Gulen schools have also used taxpayer dollars to benefit “local foundations that that promote Gulen teaching and Turkish culture.”
Greater monitoring and accountability for Gulen-linked schools is clearly imperative. In addition to investigations by the FBI, Department of Education, and Department of Labor, numerous scandals abound. A Pennsylvania Gulen-linked school, called Truebright, had a discrimination lawsuit filed against it in 2013. A former English teacher at Truebright began the civil rights lawsuit, which claimed that the school “discriminated against employees based on gender and national origin.” Nine Truebright teachers also “filed initial discrimination complaints” with the Equal Employment Opportunity Commission. The charter ended up not being reauthorized. In another case, Lancaster, PA rejected an application for a Gulen-linked charter due to application mistakes such as “carelessness and numerous cut and paste segments from other charter school applications which had no relevance to the application,” as well as a “total lack of knowledge” in curriculum planning. A 2008 investigation of an Ohio Gulen-linked school was begun by the Department of Labor about H1-B visas for teachers. The budget included money paid to people in Turkey, including people that had never worked for the school. 13,000 in “illegal immigration fees” were listed, and the school building is leased from a landlord that lives in Turkey.
Pioneer Charter School of Science in MA was praised as a model charter, but had a very high attrition rate, especially among people with disabilities. The school hired Turkish teachers while at the same time there was intense competition for teaching spots at other MA charters. 56.7% of teachers at Pioneer Charter were licensed in what they were teaching, but in public schools of the same town 99.5% of teachers were licensed. Gulen-linked schools are often high-performing in terms of student achievement. But in order to maintain credibility and long-term sustainability, the schools must ensure that their administrative decisions are accountable to taxpayers and to the government.
Conclusion
The high test score results of the Gulen schools suggest that this network is doing a competent job of education children. However, it must be remembered that the goal of education is far greater than for students to do well on tests. Students must learn in an environment that implicitly fosters growth of their whole being. Standardized test results often have limited bearing on the quality of education that a student is receiving. However, the environment and greater mission of a school implicitly affects students in everything that they do.
Gulen schools have become embroiled in scandal and controversy. While schools disassociate themselves from Gulen himself, many administration officials in his charter schools are connected to him and his religious-political cult. Numerous Gulen schools across the country are under investigation by the FBI, the Department of Education, and/or the Department of Labor. The allegations are wide-ranging, from paying female and non-Turkish teachers less than male Turks to favoring Turkish companies for construction of school buildings despite lower bids from American businesses, and forcing teachers brought over from Turkey to give a certain portion of their salary to Gulen political leaders in Turkey. Thus, despite high test scores, the Gulen schools appear to be implicated in a greater scandal that would most likely affect the students’ abilities to receive an education solely focusing on the student’s growth academically, intellectually, and socially.
Works Cited
“Addendum: Documentation of Scandals Involving Gulen Schools.” The Hayride. Web. 31 Mar. 2017.
“About Us .” Harmony Public Schools. Accessed March 24, 2017.
Schools, Harmony Public. “Why Work at Harmony?” Harmony Public Schools | Careers. Accessed April 04, 2017. http://www.harmonytx.org/hr.aspx.
Janisch, Margaret Brennan Jennifer. “Are Some U.S. Charter Schools Helping Fund Controversial Turkish Cleric’s Movement?” CBS News. 29 Mar. 2017. Web. 31 Mar. 2017.
“List of Gulen-linked charter schools in 2016-2017.” Charter School Scandals. 2016. http://charterschoolscandals.blogspot.com/p/list-of-us-gulen-schools.html.
“Philly.com Archive Hub.” Archives – Philly.com. Web. 31 Mar. 2017.
“Three L.A. Charter Schools Could Be Shut Down, Largely Because of Their Practice of Bringing in Teachers from Turkey.” Los Angeles Times. Los Angeles Times. Web. 27 Mar. 2017.
“Top Texas Charter School Network Accused of Bias, Self-dealing | News.” Dallas News. 24 May 2016. Web. 31 Mar. 2017.
Wilson, Terri S., and Robert L. Carlsen. “School Marketing as a Sorting Mechanism: A Critical Discourse Analysis of Charter School Websites.” Peabody Journal of Education 91, no. 1 (2016): 24-46. Accessed March 23, 2017. doi:10.1080/0161956x.2016.1119564.


 It asserts its unique encouragement of teacher unionization, no admission requirements other than entering a lottery, and lower funding per pupil than nearby public school districts to further this distinction. In a 2015 LA Times piece on Green Dot, the CMO’s fingerprint covers the language, reading as a long-form advertisement. The writer emphasizes these distinctions between Green Dot and other charters, without mention of any real concerns or issues within the schools, which certainly exist. Brett Wyatt, a former teacher at a Green Dot school, described his and other staff’s experiences on Diane Ravitch’s blog. Wyatt mentions frequent teacher and administrator resignations due to “unsafe working conditions” because of violent students who weren’t sufficiently punished, as well as “limited future advancement” for staff because of broken evaluation and incentive systems.
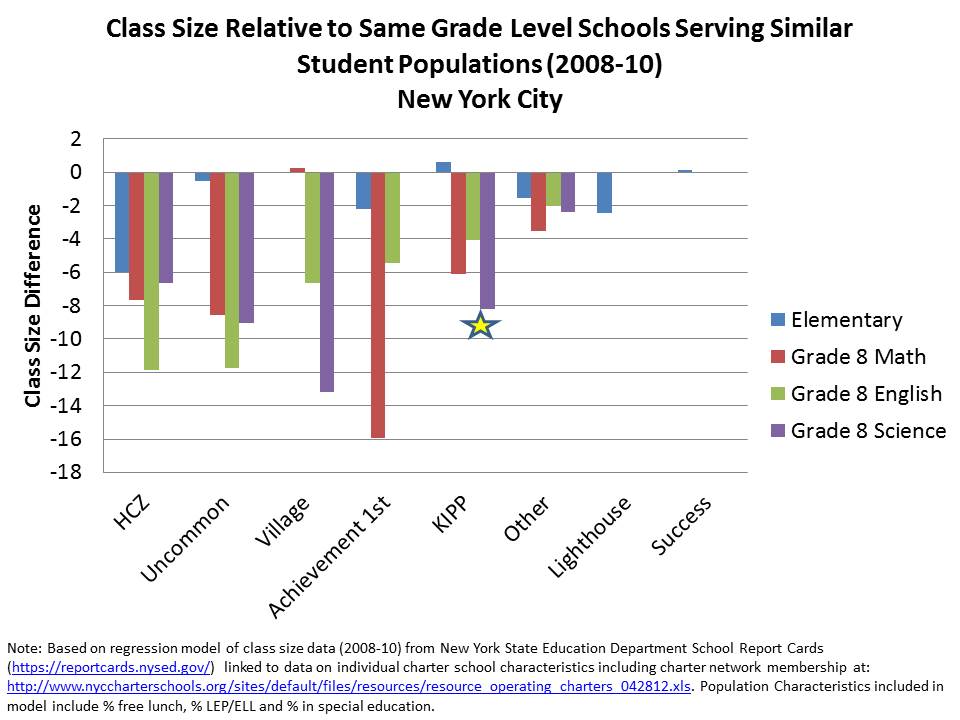


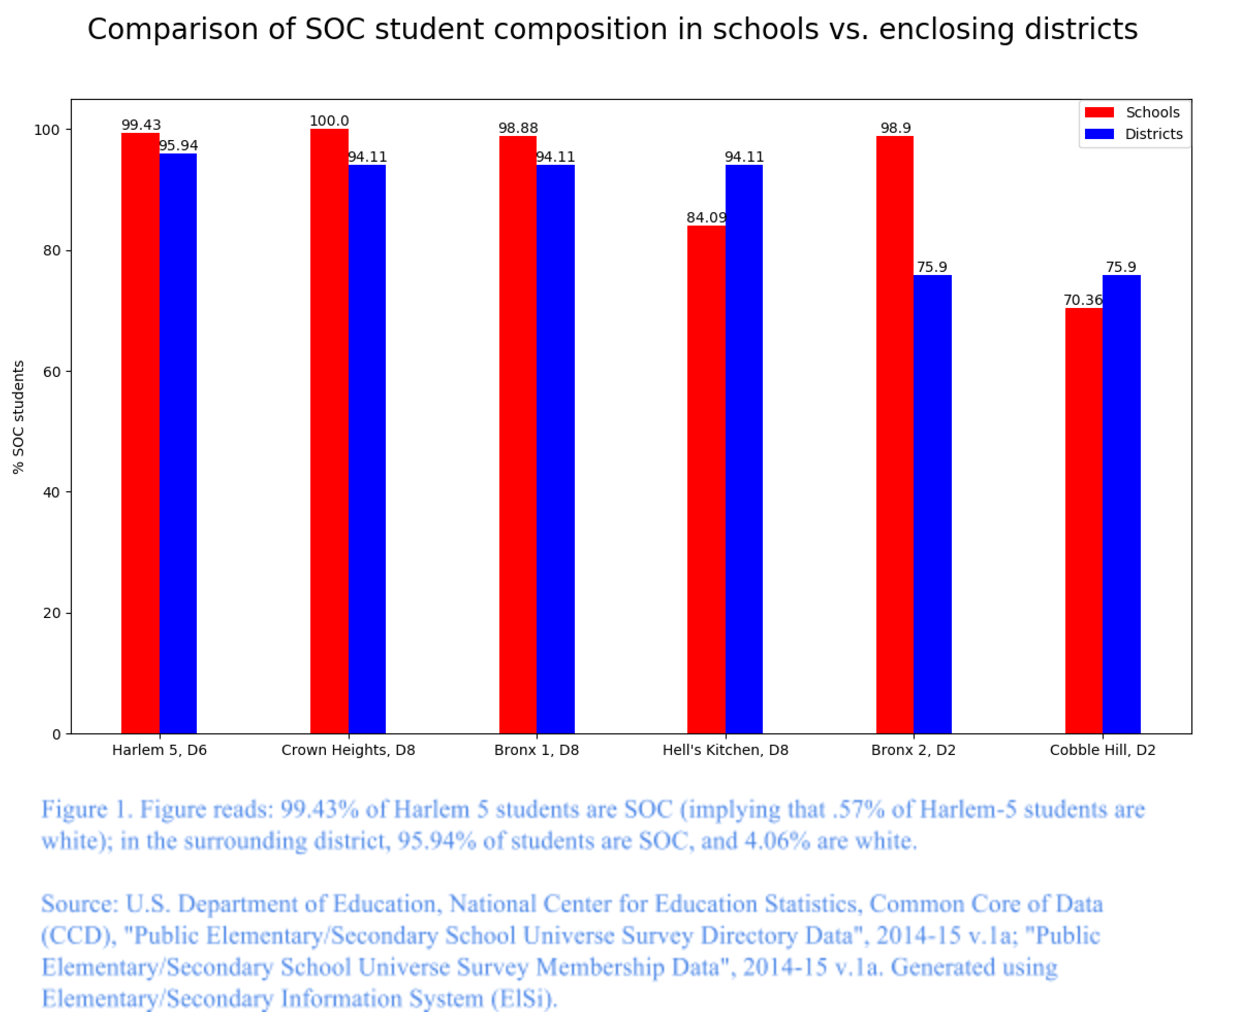
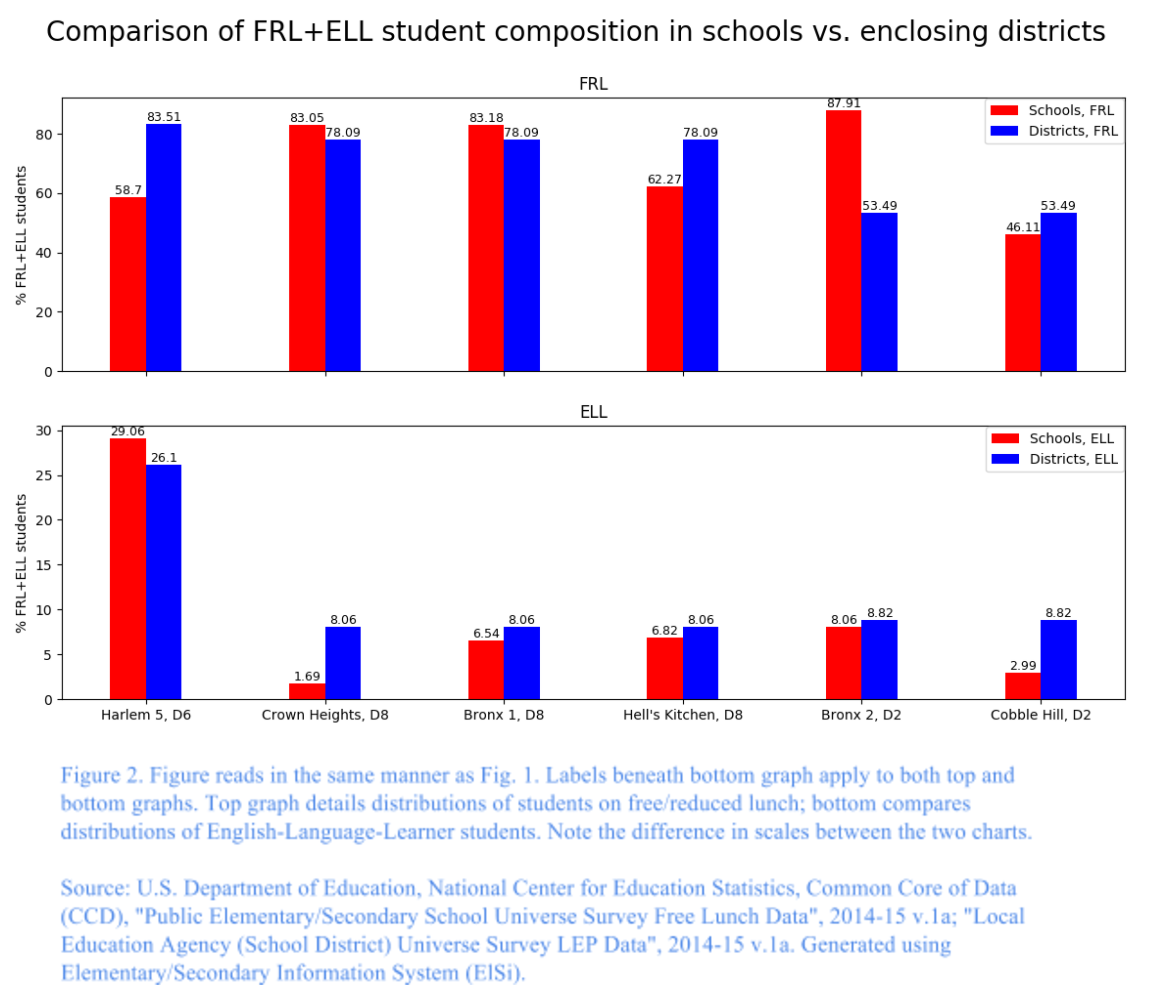
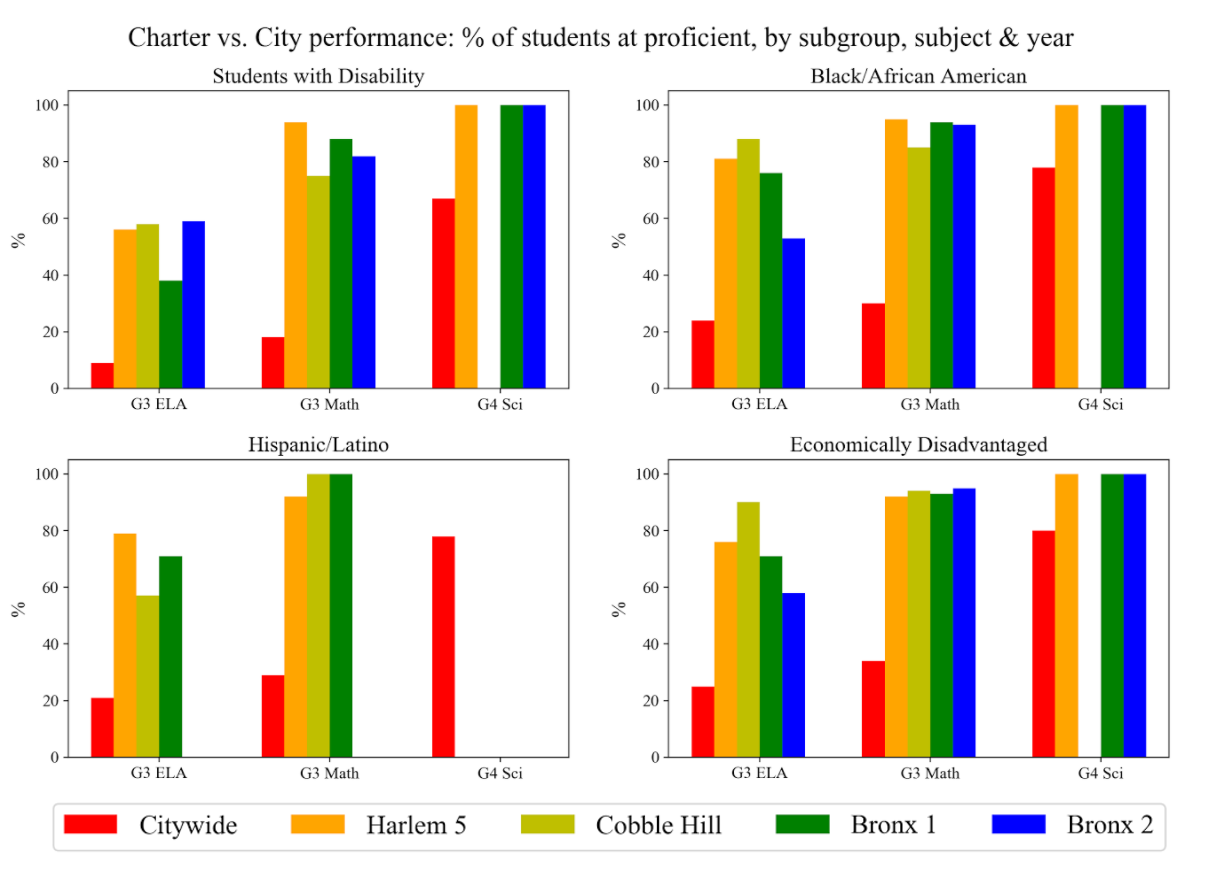
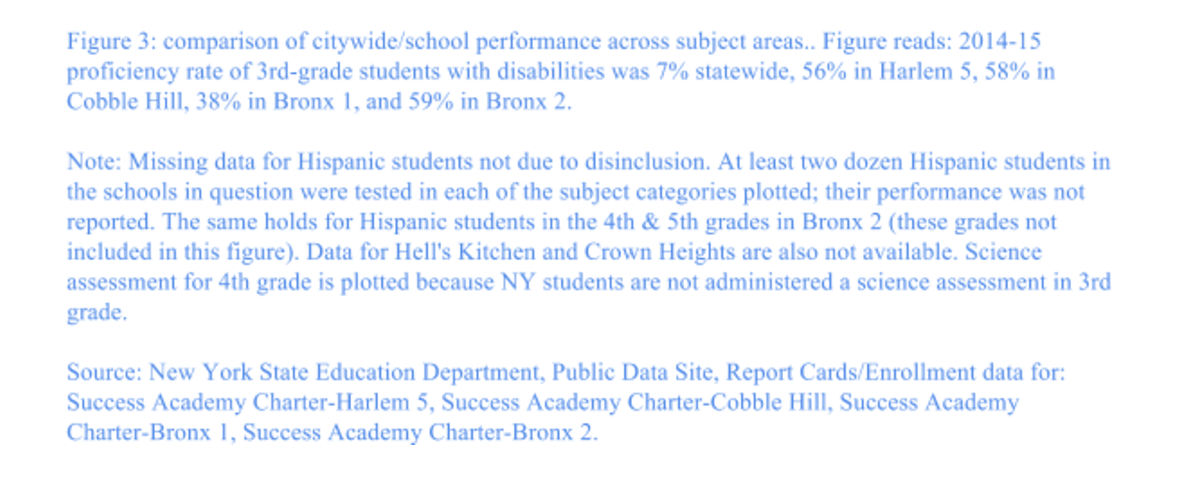
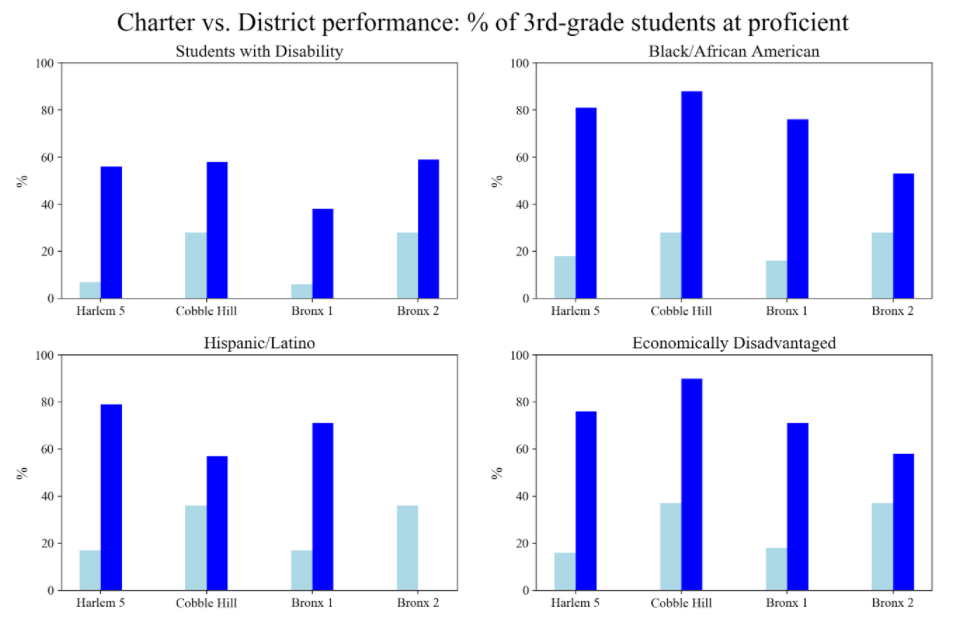
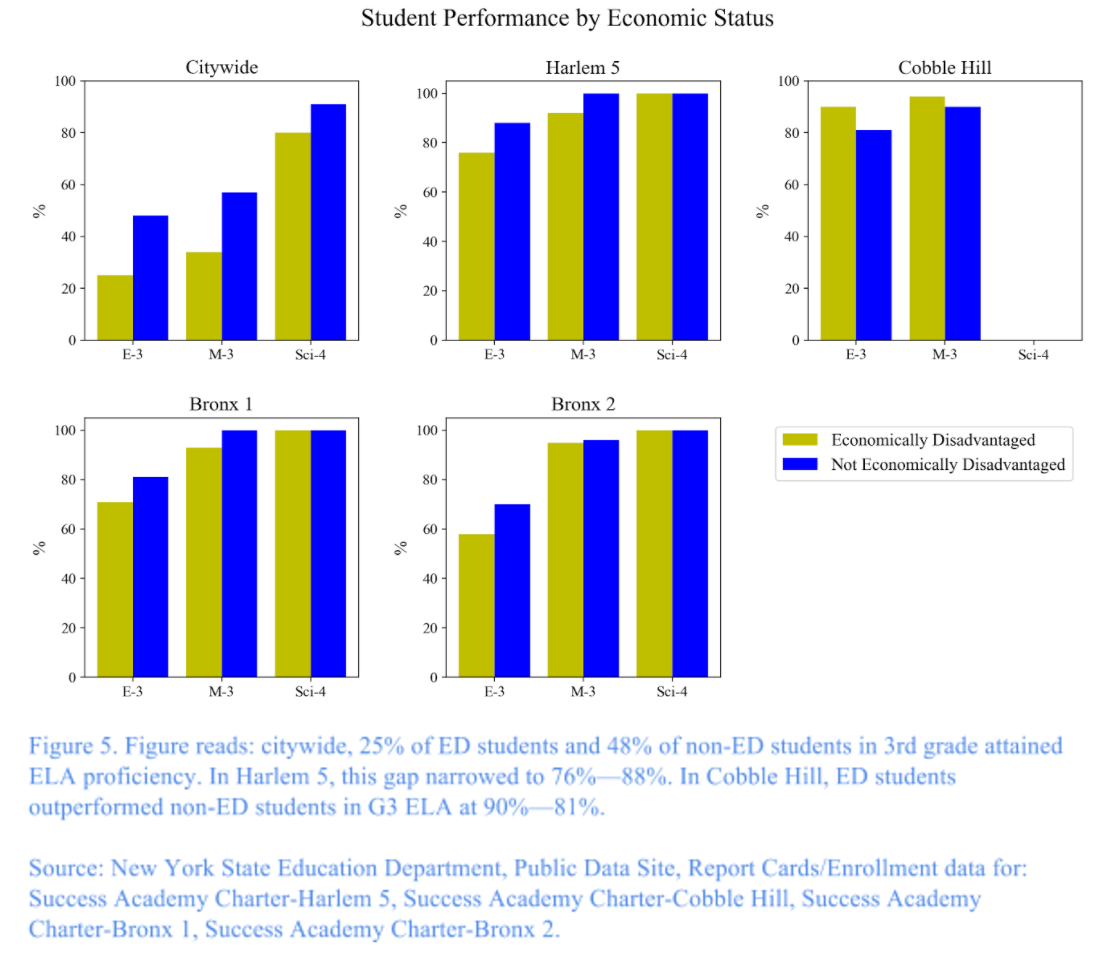
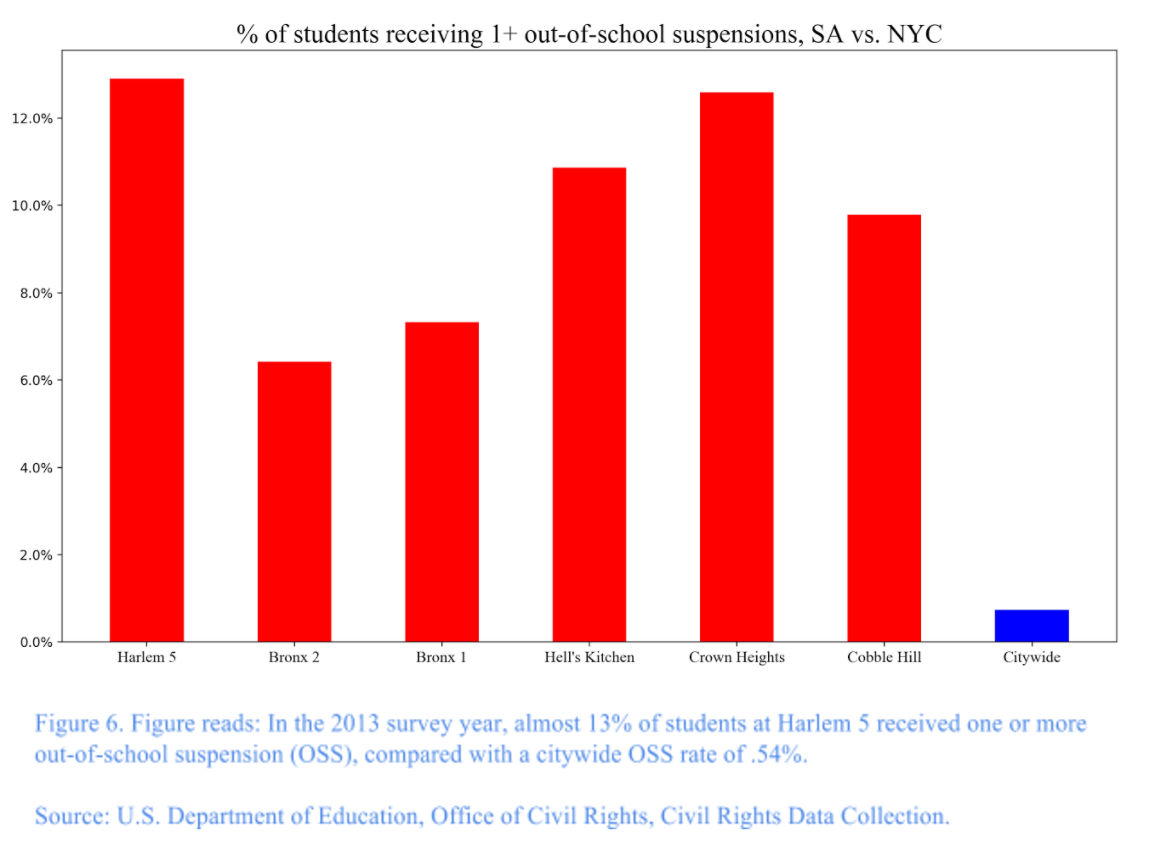
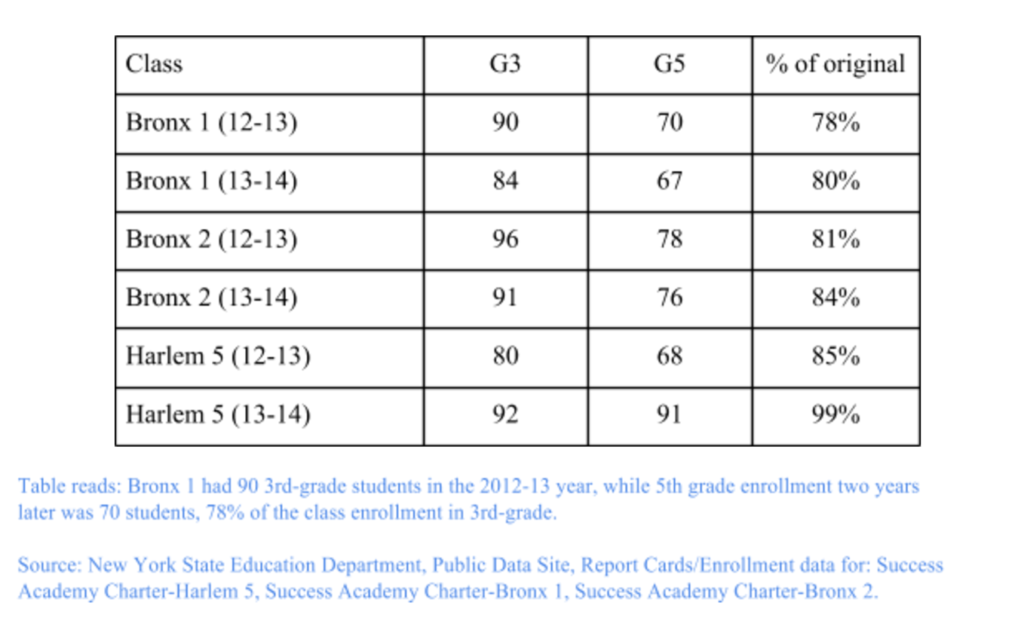
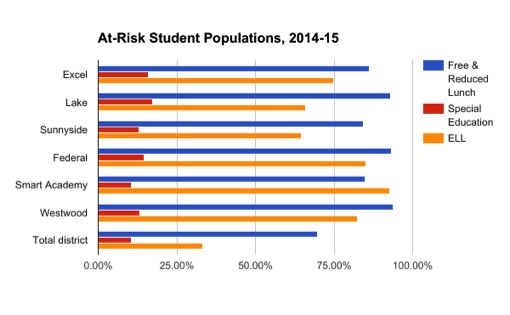
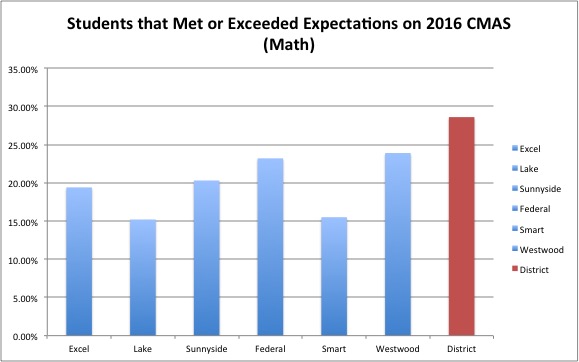
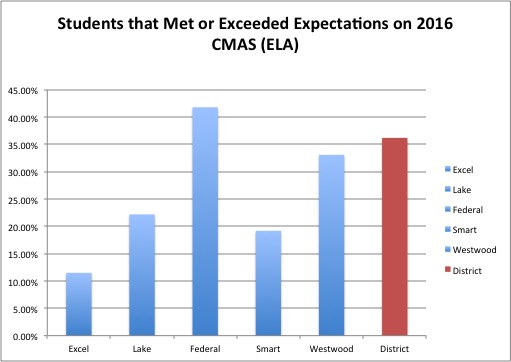
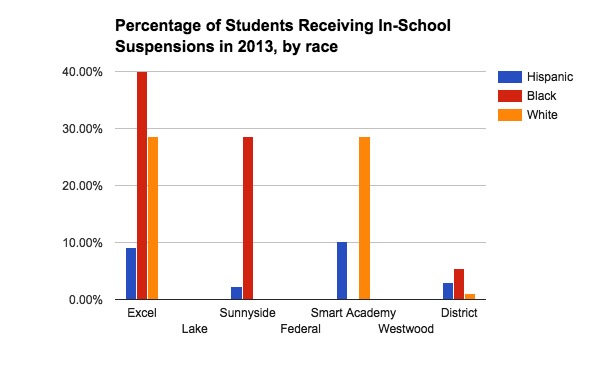

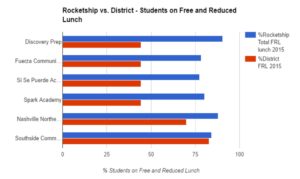
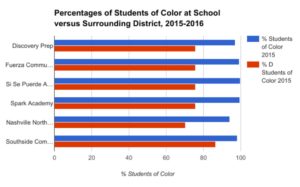
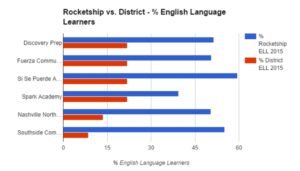
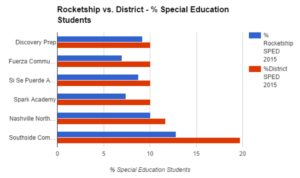
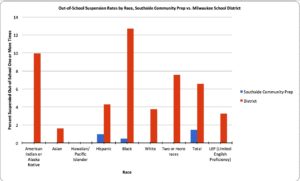
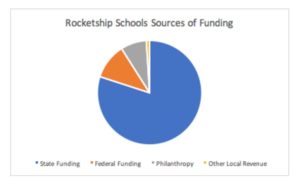
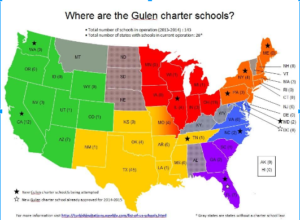
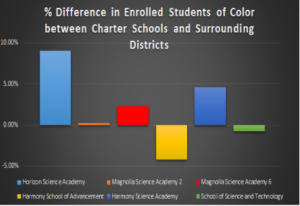
 A comparison of the free and reduced lunch data of Gulen schools and their surrounding districts makes it clear that Gulen Schools are
  om the fact that Gulen schools enroll much fewer