
Rocketship Schools: Taking Steps Towards Closing the Achievement Gap
Layla Treuhaft-Ali, Emil Friedman, Lindsay Efflant, Jake Fender
1) Introduction
Similar to other rapidly-growing charter management organizations (CMOs), Rocketship is a relatively new player in the education space, primarily targeting lower-income, minority students in urban areas. The main pedagogical innovation that distinguishes Rocketship is the use of “blended learning”: students participate in whole-group instruction, small group lessons, and spend 80-100 minutes each day in a “Learning Lab” where they practice skills on computers and work with tutors. Rocketship leaders claim that this strategy allows them to personalize education to meet each child’s unique needs, but Rocketship still faces criticism that this method is impersonal and relies too heavily on screen time.
Early data points are promising: Rocketship schools have low suspension and expulsion rates, and high academic growth scores. Although some CMOs have been criticized for self-selecting students unrepresentative of the overall communities in which they live (Frankenberg and Siegel-Hawley 2013), Rocketship generally still serves populations similar to its surrounding public school districts. By exploring, amid some criticism, various techniques in terms of pedagogy, discipline, and community engagement that a typical public school would be unable to pursue, Rocketship shows promising steps in becoming a responsible CMO that could play a healthy role alongside traditional public schools in urban centers.
Demographics, Achievement, and Discipline Methodology
We selected six schools for data investigation using a random number generator. We obtained federal, state, and district information on demographics, discipline, and achievement using the databases offered by the National Center for Education Statistics and the Department of Education’s Office of Civil Rights. Although we had some difficulty in some categories because data had not yet been published for recently-opened Rocketship schools, we were able to successfully find most data points needed.
2) History, Pedagogy, and Mission
While the crux of Rocketship’s published mission — creating alternative, high-quality education choices for vulnerable students — is credited to Father Mateo Sheedy, pastor of San Jose’s Sacred Heart Parish, who in 1999 began questioning the low performance rates of students in his parish, Rocketship began in earnest in 2006, when Father Sheedy’s congregation set off to pursue his mission of improving outcomes for students in San Jose alongside John Danner and Preston Smith. Danner and Smith, both young, energetic, and decidedly entrepreneurial, wanted to bring technology and community engagement to the forefront of the movement they intended to create (Rocketship Schools 2017a). They also, in contrast with founders of most other CMOs, wanted to focus on elementary education, figuring that students exposed to a high-quality education early may do better post-graduation in traditional schools (Ableidinger & Barrett 2013).
Soon after their first school, Rocketship Mateo Sheedy Elementary, opened, its waiting list grew to the point that Danner and Smith knew Rocketship was ripe to expand. During Rocketship’s next ten years, it opened an additional fifteen schools, mostly in San Jose but also with locations in Nashville, Milwaukee, and Washington, D.C. Rocketship originally aimed to serve one million students by 2020, but has since reduced its goal to 25,000 students by 2017 (Bernatek et al. 2012).
Through its mission to “eliminate the achievement gap in our lifetime,” Rocketship targets minority, low-income, urban students in tandem with a particular interest in engaging these students’ parents as well (Rocketship Schools 2017a).
3) School Demographics
We considered an objective data analysis to be important in determining that Rocketship acts as a responsible CMO in serving a broad cross-section of students. For our analysis, we investigated six Rocketship schools: Discovery Prep, Fuerza Community Prep, Si Se Puerde Academy, Spark Academy, Nashville Northeast Elementary, and Southside Community Prep.
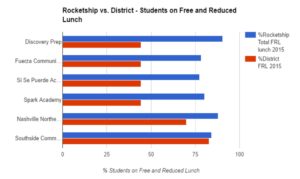
(Figure 1)
Confirming Rocketship’s claimed interest in “eliminating the achievement gap in our lifetime,” it is not surprising that its student bodies are typically more disadvantaged than their districts’ overall populations. Based on our data, Rocketship’s student population is high-poverty: more than three-quarters of students are on free or reduced lunch (FRL) at every school. This is especially significant in the San Jose school district, where FRL students are a minority in the district as a whole (Figure 1).
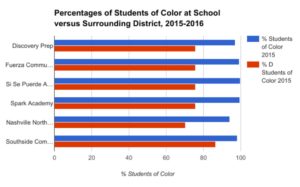
(Figure 2)
Unsurprisingly, high minority populations in Rocketship schools coincide with socioeconomic disadvantage. Overall, 95% of Rocketship students are students of color. In the Bay Area and Milwaukee schools, student bodies are majority Hispanic; Nashville Northeast Elementary was the only school with a large African-American population (Figure 2). This seems in line with Rocketship’s responsibly serving the communities in which it has schools.
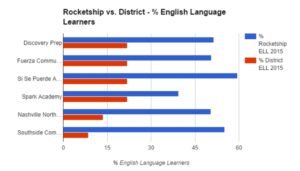
(Figure 3)
Perhaps starker than socioeconomic and racial representation, in Rocketship schools across every region, English Language Learners are represented at between two and four times the rate of their representation in the district overall (Figure 3). One reason for this may be Rocketship’s “blended learning” strategy: students spend about two hours a day in a “learning lab” where they work individually with tutors, small teams of their peers, and online programs. This “personalized learning” time may be especially beneficial for English Language Learners, who can use the time to build language skills or work on academic content at their own speed.
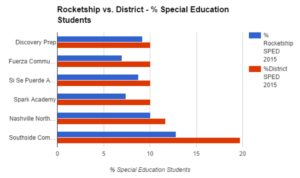
(Figure 4)
Unlike the other three categories we analyzed, special education students are underrepresented at Rocketship schools, especially at Fuerza Community Prep in San Jose and Southside Community Prep in Milwaukee (Figure 4). This is somewhat surprising, since it seems that Rocketship’s individualized learning model would be well-adapted to working with students with special needs. However, limited resources may account for this discrepancy, raising questions with respect to Rocketship’s role in a public school district and offering one counter-narrative to Rocketship’s otherwise fairly-equitable, fairly-responsible nature (National Center for Education Statistics).
4) Student Achievement
In conjunction with its largely-vulnerable student body, Rocketship shows great interest in its low attrition rates; last year, 90% of Rocketeers chose to stay with Rocketship despite each having a district spot available to them. In terms of assessment, Rocketship uses standardized tests, such as Northwest Evaluation Association’s Measured Academic Progress test (NWEA MAP), in the fall, winter, and the spring, to determine both how their students’ proficiency matches up to that of students from similar socioeconomic backgrounds in district schools, and also to measure how their students’ performance is changing over time (Rocketship Schools 2017b).
Comparison to public school counterparts
Rocketship students do quite well compared to their counterparts in the public school system. In the 2015-2016 school year, Rocketship students overall outperformed their counterparts at impressive rates: in the third grade, 83% of math scores and 59% of language arts scores were above public school counterparts, in the fourth grade, 100% of math scores and 88% of language arts scores were above (public school counterparts), and in the fifth grade, 100% of math scores and 60% of language arts scores were above those of the students’ public school counterparts (Kamenetz 2016). In general, Rocketship saw standardized test scores parallel to or slightly higher than those of their schools’ states overall as well (National Center for Education Statistics 2016).
Particularly impressive is a ranking of top-performing Bay Area schools, where Rocketship locations are most concentrated, for low-income Latino students in mathematics. In the report, of the eighteen schools listed, six of them belong to the Rocketship network (Innovate Public Schools 2016).
Student growth
Tracking 1,300 students’ achievement on the NWEA MAP test from the fall of 2012 to the spring of 2016 shows that the percentage of students performing at or above grade level in math went from 34 to 62% (a 28% increase), and that the percentage of students performing at or above grade level in reading went from 25 to 56% (a 31% increase). These figures are significant because they show how a student’s contact with a Rocketship school is changing their achievement from what it would have been had the student remained in a district school. The average first year growth, as measured by students’ tracked performance on the MAP test, is 1.53 years of growth in mathematics and 1.39 years of growth in reading (Rocketship Schools 2016a). We view this as a strong indicator that Rocketship is responsibly serving its communities.
5) Discipline
Perhaps in line with its interest in academic growth, Rocketship claims to be dedicated to keeping students in class; their 2015-2016 Year in Review report has an entire subheading entitled, literally, “Keeping Kids in Class,” and the good news is that Rocketship largely seem to be doing that. In the 2015-2016 school year, they had a 2.6% suspension rate, and in each school we analyzed, the school’s suspension rate, both in total and disaggregated by race, was lower than its district counterpart, and in many cases was zero (Department of Education: Office of Civil Rights 2016). In addition, no school in Rocketship’s entire history has ever expelled a student (Rocketship Schools 2016a). Interestingly, Rocketship offers very little literature regarding disciplinary practices on its official website, raising questions with respect to transparency.
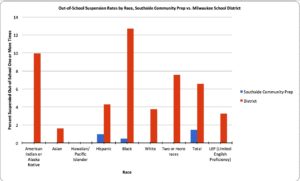
(Figure 5)
The one Rocketship school we examined, Southside Community Prep, whose suspension rate was higher than zero shows clearly a difference between its rates and those of its surrounding district (Figure 5).
6) Media and Marketing
Unsurprisingly, given its demographics, Rocketship marketing items themselves take a social-justice-oriented look at education, discussing often “achievement gaps” and “low-income students,” with branding similar to that of a technology start-up. Most multimedia features minority students, and the website is available in 100 languages, suggesting that Rocketship makes few attempts to subtly select for wealthier, whiter students (Rocketship Schools 2017a).
In this typical marketing video, for example, Rocketship emphasizes its personalized learning techniques and rapid growth model as a strategy for rapidly ending the achievement gap, particularly among low-income and minority students (Rocketship Schools 2013).
Major media coverage of Rocketship schools includes a segment on “Learning Matters,” part of PBS NewsHour produced by Education Week. Although the segment offered considerable praise, in terms of criticism, the segment argues that the Learning Labs don’t work, and shows shots of students looking disengaged from their computer learning activities (PBS NewsHour 2013).
NPR also covered Rocketship in a more negative light this year in a widely-read profile. Its report accuses Rocketship of maintaining far too low a staff-student ratio: at one Rocketship school, six full-time teachers served 630 students. Aides filled in the gaps: individualized tutors reported monitoring between sixty and ninety students alone during Learning Lab time. The article also criticizes Rocketship for having young children spend between 80 and 100 minutes in front of a computer each day, requiring several hours of silent time (called “Zone Zero”) each day, and refusing to let children go to the bathroom such that even older children wet themselves. Finally, the article suggests that Rocketship is too focused on test scores, to the point where teachers have students retake standardized tests in order to boost scores (Kamenetz 2016). It is fair to note, however, that these criticisms of Rocketship are common critiques of charter schools and CMOs in general as well.
7) Accountability and Oversight
In line with its “achievement gap”-oriented marketing narrative, Rocketship’s main method of accountability consists of measuring its students against those at other schools, mainly according to growth rather than proficiency. Rocketship graduates have been projected, according to NWEA MAP math and reading tests, to be equivalent to one year of growth ahead of their peers at other schools. Rocketship schools in California have been ranked in the top 10% in the state in math and ELA performance, while Rocketship Milwaukee is ranked number one in math and language arts performance, and Rocketship Nashville is in the top two in the city among all 73 public elementary schools (Rocketship Schools 2017b).
Additionally, Rocketship Schools uphold teacher and test-score accountability standards but are especially unique due to the importance they place on parental involvement. Rocketship Schools mandate that every family devote at least eighty hours of volunteering time per year to their child’s classroom. It is common to find parent volunteers working alongside teachers during classroom activities and field trips (Ableidinger & Barrett 2013).
Data with respect to funding between individual districts and Rocketship is not publicly available, and while Rocketship hasn’t yet encountered significant financial scandals, transparency still is limited.
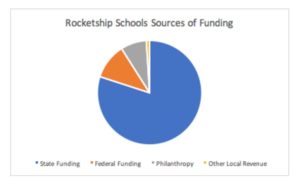
8) Funding and Budget
Unlike its particular arrangements with individual district, Rocketship is transparent with overall funding sources. The Rocketship Schools budget is broken down as follows: 80% state funding, 11% federal funding, 8% philanthropy, and 1% “other local revenue.” Rocketship’s website lists the top 32 donors from 2015-2016 ranked by level of donation: $5,000 and above (11 donors), $25,000 and above (5 donors), $100,000 and above (11 donors), $500,000 and above (2 donors), and $1,000,000 and above (3 donors) (Rocketship Schools 2016b).
(Figure 6)
According to our analysis using Rocketship’s budget breakdown [1], we can calculate that the bare minimum state funding is $52,800,000, the bare minimum federal funding is $7,260,000, and the bare minimum “other local revenue” funding is $660,000. Perhaps most notable is how large the state funding component is. It is clear, then, that one of Rocketship’s main priorities as it grows ought to be maintaining responsible, mutually-beneficial relationships with states.
The donors listed on Rocketship’s website include mostly individual and collective venture capitalists and non-profit organizations. A fair amount of the donors (most of the nonprofits and a significant number of the individual venture capitalists) seem dedicated to education funding (the individual foundations often had a history of investment in educational ventures), but what was interesting was that some of the collective venture capital organizations (like Baird) don’t seem overly attached to education as a philanthropic end in and of itself (Rocketship Schools 2016b).
9) Staffing
Just as Rocketship is unafraid to accept funding from a diverse array of donors, it is similarly unafraid to source teachers from non-traditional teacher pathways. Indeed, 75% of Rocketship teachers come from Teach for America and about half have less than two years of teaching experience (PBS NewsHour 2013). Because of Teach for America’s generally temporary nature, it is clear that teacher longevity and loyalty is not considered a significant factor in Rocketship’s faculty development. One of the reasons that may account for this is Rocketship’s reliance on Learning Labs with personalized computer learning and untrained staff, meaning that students are already used to seeing variation each day in their teachers and caretakers. It would be fair to assume that the constantly-rotating nature of Rocketship faculty means that students interact with many different staff members during their years in a Rocketship school, and that each school has limited potential for mentorship for new teachers by veteran teachers.
Rocketship offers professional development to new teachers, including mentorship from administrators and more experienced teachers. 50% of a teacher’s salary is tied to students’ test scores (Kamenetz 2016). Teachers are not unionized, but they receive higher pay and benefits than average teachers in their districts. This works because of Rocketship’s Learning Lab model. The “individualized tutors” who mentor Rocketship students during Learning Lab time are hourly employees who are not certified teachers and can be paid at lower rates. This allows Rocketship to hire six fewer full-time teachers per school than they would otherwise, saving the organization $500,000, which is used to increase teacher pay and program funding (Rocketship Schools 2017).
10) Relationship to districts
Relationships with districts vary. Perhaps due to Rocketship’s unorthodox structure, in some Bay Area schools, there is a disconnect between families of Rocketship students and of non-Rocketship public schools and between the district and Rocketship itself. Among parents in the Bay Area, there has been an outcry of frustration that “the local school district has routinely targeted the school, students, and families with discriminatory language and action” (Gil 2017). The Mt. Diablo Unified School District, which contains the Rocketship Futuro Academy, has limited the school’s ability to provide the legally mandated space for serving food, which compromises the 80% of free-and-reduced-lunch students’ ability to receive their meals. Many parents see this, and the district’s reluctance to provide the school other proper physical spaces, as a personal attack (Gil 2017). In tandem, there is little evidence of significant collaboration between Rocketship and surrounding districts in terms of pedagogy and practice.
11) Conclusion
As a CMO, Rocketship operates a fairly sound, well-performing, equitable system. In terms of the purposes of education, Rocketship certainly contributes to the social mobility of lower-income students by typically offering higher academic growth rates than they would otherwise find in their district public schools. It also contributes to democratic equality, with the important exception of disabled students, whose Rocketship enrollment does not parallel surrounding schools. Nonetheless, Rocketship appears to be serving vulnerable students well, responsibly serving its communities with good achievement data to show for it. It would serve Rocketship well to continue to grow at a moderate, responsible pace.
(2495 words excluding headers and citations.)
Footnotes
[1] Funding and Budget Methodology
Each figure in the following budget analysis comes from Rocketship’s reporting of its own finances. The approach we used calculates the absolute bare minimum dollar values for each portion of the budget, based on Rocketship’s budget breakdown and its reporting of top donors and the amount categories they fell into.
The following is a calculation of what the absolute bare minimum Rocketship Education budget must be. It involves calculating what the bare minimum philanthropic portion of the budget is (based on the donations listed on the website), and then using that number to calculate the bare minimum total budget (based on the fact that we know that philanthropy comprised 8% of the total budget), and then finally using that estimation of the total budget to disaggregate the bare number of dollars that each portion must be composed of. The calculation is based on two assumptions: first, that a donor in the category “$___ and above” actually only gave the bare minimum to be included in that category, and second, that the donations beneath the levels listed on the website do not significantly impact the philanthropic portion of the budget. Thus, this is inevitably just an exercise to determine what the absolute bare minimum dollar value of each part of the budget is comprised of, and will be distant from the actual budget values, with an error directly related to how false the assumptions (especially the second) happen to be.
So, first, if we calculate the philanthropic portion, we will (based on the assumptions listed earlier) perform the following calculation for each group: number of donors in group * bare minimum needed to be in group, and we will add each of these together. Thus, we get $5,000(*11)+$25,000(*5)
+$100,000(*11)+$500,000(*2)+$1,000,000(*3), which equals $5,280,000. This (the bare minimum of 8% of the total budget) leads us to calculate that the bare minimum of the total budget amounts to $66 million. Then, based on Rocketship’s budget breakdown, we can calculate that the bare minimum state funding is $52,800,000, the bare minimum federal funding is $7,260,000, and the bare minimum “other local revenue” funding is $660,000 (Rocketship Schools 2016b).
Bibliography
Ableidinger, Joe and Sharon Barrett. 2013. “Rocketship Education: A Case Study.” Opportunity Culture. Accessed April 14, 2017. http://opportunityculture.org/wp-content/uploads/2013/07/Rocketship_Education_An_Opportunity_Culture_Case_Study-Public_Impact.pdf
Bernatek, Brad and Jeffrey Cohen and John Hanlon and Matthew Wilka. 2012. “Blended Learning in Practice: Case Studies from Leading Schools.” Accessed April 14, 2017. http://5a03f68e230384a218e0-938ec019df699e606c950a5614b999bd.r33.cf2.rackcdn.com/msdf-rocketship_04.pdf
Department of Education: Office of Civil Rights. 2016. “Civil Rights Data Collection.” Accessed March 10, 2017. http://ocrdata.ed.gov/.
Frankenberg, Erica and Genevieve Siegel-Hawley. 2013. “A Segregating Choice? An Overview of Charter School Policy, Enrollment Trends and Segregation.” Pp. 129-44 in Educational Delusions? How Choice Can Deepen Inequality and How to Make Schools Fair, edited by G. Orfield and E. Frankenberg. Berkeley, CA: University of California Press.
Gil, Marie. 2017. “They Can Take Away Our Garden But They Can’t Take Away Our Unity.” Accessed March 30, 2017. https://blog.rsed.org/2017/02/06/they-can-take-away-our-garden-but-they-cant-take-away-our-unity/#more-5821.
Kamenetz, Anya. 2016. “High Test Scores At A Nationally Lauded Charter School, But At What Cost.” nprED, June 24.
Innovate Public Schools. 2016. “2016 Top Schools.” Accessed March 30, 2017. https://reports.innovateschools.org/2016-top-schools.
National Center for Education Statistics. 2016. “Public Schools Data.” Accessed March 10, 2017. https://nces.ed.gov/ccd/districtsearch/.
PBS NewsHour. 2013. “Learning Matters: Rocketship.” Accesses March 30, 2017. https://www.youtube.com/watch?v=6k1apG569pY.
Rocketship Schools. 2016a. “2015-16 Year In Review.” Accessed March 30, 2017. http://www.rsed.org/documents/Rocketship2015-16YearinReview.pdf.
Rocketship Schools. 2016b. “Financial Statements.” Accessed March 30, 2017. http://www.rsed.org/documents/RocketshipEducationandItsAffiliatesConsolidatedAuditedFinancialStatementsfortheYearEndedJune302015.pdf.
Rocketship Schools. 2017b. “Results.” Accessed March 30, 2017. http://www.rsed.org/results.cfm.
Rocketship Schools. 2013. “Rethinking Elementary School from the Ground Up.” Accessed April 23, 2017. https://vimeo.com/61889636.
Rocketship Schools. 2017a. “Who We Are.” Accessed March 30, 2017. http://www.rsed.org/who-we-are.cfm.