Emil Friedman
EDST 245
Final Policy Paper
Spring 2017
Massachusetts and the Charter Cap: Accountability, Balance, and Implications for the Nation
Executive Summary
As the United States continues to grapple with developing a comprehensive education policy that strikes a balance between supporting neighborhood public schools and acknowledging the progress, particularly in low-income and minority communities, made by charter schools, this paper examines the Commonwealth of Massachusetts as a potential example for the nation. While other research has examined Massachusetts’ charter school academic performance and journalists have extensively covered the state’s 2016 charter cap referendum, my report is one of the first to treat Massachusetts as an extended case study upon which a federal policy could be based. After describing the high stakes that characterize school choice debates, I track the purpose of charter schools, defining them both in terms of theory and Massachusetts state law. I then offer a comprehensive profile of Massachusetts’ approach to charter schools, including an analysis of Massachusetts’ charter cap system alongside an examination of various data trends accompanying the policy, including the conclusion that the cap seems to have produced charter schools which appear to be serving Boston’s and other urban areas’ low-income and minority communities particularly well, although this pattern is not necessarily replicated in non-urban schools. I then take a turn towards the political, describing Massachusetts’ 2016 referendum on lifting its charter cap, closing the paper with a discussion of a hypothetical federal charter cap based upon the one found in Massachusetts.
Introduction
This paper will attempt to make a largely objective, unbiased assessment of Massachusetts’ charter school landscape. As I open the paper, however, I qualify that the stakes behind this kind of work are perhaps loftier, perhaps more normative, than pure public policy analysis. This – the ways that American students, particularly those who are vulnerable, are educated in publicly-funded schools – matters because it speaks to what this nation can accomplish. Will America embrace one of John Dewey’s core purposes of education, the potential for social mobility[1], by which everyone who works hard can get ahead, or will it retreat to, as President George W. Bush termed, the soft bigotry of low expectations, particularly for high-needs students? Will America remain stubborn in its politically-motivated, interest-group-centered approach to education policy, or will it finally view our nation’s most important job – educating its children – as a mission sacred enough to avoid the partisan fray? Will America be willing to challenge the status quo?
In short, the principles that drive the criteria of this paper, the rubric it takes to Massachusetts, are deeply ideological. This is not merely a discussion of granular policies in a single state. This is a microcosm of the difficult, ultimately student-focused, results-motivated investigation we must take to the nation. The stakes could not be higher.
Background: Charter Schools in Massachusetts
Precise legal definitions of charter schools can be nebulous and vary by state. In Massachusetts, a charter school “is a public school that is governed by a board of trustees and operates independently of any school committee.”[2] Charter schools have significant flexibility in terms of pedagogy, curricula, and budgeting, while being mandated to produce acceptable academic results in exchange for charter renewal. Specific to Massachusetts is a distinction between “Commonwealth” schools and “Horace Mann” schools. Horace Mann schools are required to have their charters approved not only by the state Board of Education, but also by a local school committee and, in some cases, a local teacher’s union, while Commonwealth schools are free from this increased obligation.[3]
One purpose accepted by scholars of charter schools is for them to serve as neighborhood-driven public education laboratories, using their relative freedom from state and national guidelines to experiment pedagogically and ultimately serve as models for district public schools while tailoring instruction to the communities in which they exist.[4],[5] Massachusetts state law codifies this purpose in G.L. c. 71, § 89, which, in part, states that charter schools are to be established “to stimulate the development of innovative programs within public education” and “to provide models for replication in other public schools.”[6]
In the twenty years since the first Massachusetts charter school opened following the passage of the Massachusetts Education Reform Act of 1993, charter schools both nationwide and within Massachusetts have strayed from their original, neighborhood-driven roots and have become increasingly corporatized; statewide, parents of students in charter schools comprise only 14% of charter trustees, with more than double that percentage – 31% – comprised by corporate representatives. A whopping 60% of charter schools have no parent representation on their boards of trustees, and these charter schools tend overwhelmingly to serve low-income, majority Black and Latino communities.[7] Indeed, charter schools in Massachusetts have grown far from their grassroots origin. This increasingly corporatized environment exacerbates the politicization of charter schools in Massachusetts, increases partisanship in education policy debates, and forms a critical lens through which this paper will investigate charter performance.
Massachusetts’ Charter Cap: Definition and Purposes
The tool Massachusetts uses, in part, to counter the corporatization trend – the tool whose effectiveness this paper will address – is known as a charter cap. This cap represents a clearly-defined limit of charter growth in the state, designed to strategically target communities with underperforming district schools and limit charter presence in communities with high-performing district schools. Among other criteria, Massachusetts’ cap limits the number of charter schools approved in a school district with student standardized test performance in the top ten percent statewide to only one per year, mandates that at least two charter schools per year be approved in school districts with student standardized test performance in the bottom ten percent statewide, and restricts Commonwealth charter schools (again, the more “laissez-faire” of the two types of Massachusetts charter school) to communities with populations over 30,000.[8]
The purposes of Massachusetts’ charter cap are several. First, the cap helps ensure that funding for district public schools is stable and reliable. Because students attending charter schools carry with them funding that otherwise would go to their public school district, capping charter schools means that district leaders can predict yearly funding more easily based upon the number of charter schools authorized in their district. Second, the cap is designed to produce favorable academic results for students; by forcing many charter startup groups to apply for only a low number of charter allowances, natural competition forces charter schools in Massachusetts to perform relatively highly; this paper will investigate this purpose further. Third, the exact specifications of the charter cap can serve as a political chess piece: in negotiations with unions and corporate special interests, generally limiting charter schools while allowing for some to exist alongside district public schools nudges Massachusetts’ education landscape towards the middle, politically, rendering it more likely to satisfy competing interests.
By the Numbers: Charter School Landscape Under Massachusetts’ Cap
Beyond the policy on paper, Massachusetts’ cap has produced a significantly stratified charter school landscape by a variety of metrics. Here, I present and discuss trends in Massachusetts charter schools, reported by Massachusetts’ Department of Education, current as of the 2016-2017 school year.[9]

(Figure 1)
Charter schools in Massachusetts do not tend towards any particular grade level and instead are somewhat equally distributed across elementary, middle, and high school levels (Figure 1). This suggests, but does not confirm, a significant feature of Massachusetts’ charter system: there seems to be consistency in that students would tend to enter the charter system and stay in the charter system for their entire schooling instead of moving between the charter system and neighborhood public schools. An interesting further study of the health of Massachusetts’ charter system would investigate the retention rates of Massachusetts charter schools in contrast with their district public school counterparts.

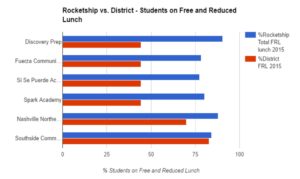
(Figure 2)
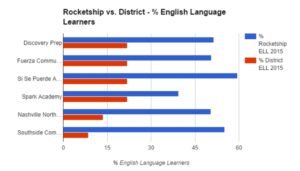
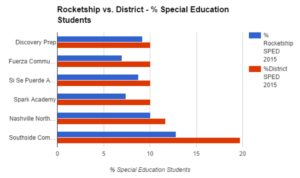
Another important measure of charter school equity is the distribution of student populations served. Massachusetts charter schools tend to serve populations that are, in general, more socioeconomically vulnerable than the state as a whole, save for special education (Figure 2). It is important to add, however, that Massachusetts charter schools’ not serving a representative portion of special education students is a common trend nationwide. In contrast, serving other groups of vulnerable students as equitably as Massachusetts charter schools seem to do is not a norm; some charter schools, particularly in cities, participating in “creaming,” or selecting deliberately for higher-achieving, lower-needs students.[10] Creaming does not appear to be a widespread trend in Massachusetts, which is a fair indicator that the state’s charter system is being run responsibly in terms of access and original purpose.

(Figure 3)
Alongside an examination of populations served should come an examination of charter demand. Although an exact demographic breakdown of waitlisted students is unavailable, about a quantity equivalent to three-fourths of current charter school students are on a waitlist (Figure 3). This is a critical figure because Massachusetts’ charter cap, by definition, limits the number of students enrolled in charter schools. This premise would form a basis of a 2016 referendum on lifting the charter cap, discussed later in this paper.

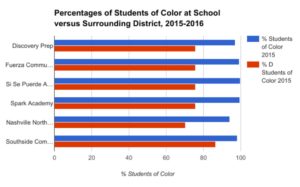
(Figure 4)
In line with the socioeconomic trends described by Figure 2, Massachusetts’ charter schools tend to serve a disproportionately minority population, with only half the state average of white students attending charter schools. Charter schools overall serve about one-third white students, one-third Hispanic students, and one-third Black students (Figure 4).

(Figure 5)
Explaining the demographic trends indicated in Figures 2 and 4 is the breakdown of charter schools in Massachusetts by community type. Charter schools tend overwhelmingly to be in urban areas – Boston and other cities – aligning with the typical trend that lower-income and minority populations tend also to be concentrated in cities (Figure 5). This makes sense in terms of the text of Massachusetts’ charter cap law itself, which, as discussed in the Definition section, places an emphasis on lower-performing school districts (tending towards cities, not suburbs) and higher population districts, with Commonwealth charter schools prohibited in communities with fewer than 30,000 residents.[11]

(Figure 6)
A key statistic provided by the state Department of Education complicates the trend found in Figure 3: while state charter schools overall have a lengthy waitlist, not every charter school is at capacity, because the total number of students attending charter schools is lower than the total maximum enrollment allowed under charters authorized by the cap (Figure 6). This suggests that charter demand is concentrated in certain areas and relaxed in others.
In fact, charter demand is concentrated strongly in Boston: out of the 32,600 students on charter waitlists, a full 10,300 reside in Boston, even though Boston is already the highest-spending district in Massachusetts on charter schools, at 14% of the total district budget. On the other hand, Amherst, which is richer and whiter than Boston alongside a relatively high-performing district, has a charter waitlist under 100.[12]
In broader terms, we can conclude that charter schools in Massachusetts overwhelmingly serve lower-income, minority populations. In terms of the cap, demand for greater enrollment is heavily concentrated in cities, especially Boston. This would set the stage for the political landscape characterizing the 2016 referendum.
By the Numbers: A Brief Overview of Massachusetts Charter School Performance
One of the key goals of a charter cap is that limiting charters will force charter schools, while competing for authorization slots, to develop a high-quality school plan that would translate to excellent academic results for students. In practice, however, examining Massachusetts charter schools tells two stories.
The first is a story of urban charter schools, and the story has a happy ending. Urban charter high schools overall saw a standardized test improvement per year of 0.39 standard deviations in math and 0.27 in English, showing the legitimate progress that urban charter schools are making, particularly for the vulnerable students that urban schools serve. Similar statistics are found at the elementary and middle school levels.[13]
We find a completely different story in non-urban charter schools, where enrollment demand is much lower than that in urban areas. Unlike their urban counterparts, non-urban charter high schools overall saw a standardized test decrease per year of -0.30 in math and -0.05 in English. Similar statistics are found at the elementary and middle school level.[14] Broadly speaking, then, non-urban charter schools actually tended to hurt students, not help them.
From a policy standpoint, this disparity raises a key problem with the way Massachusetts’ charter cap currently works. While it does already show favoritism to urban charter schools, not non-urban, from a purely performance-based point of view, Massachusetts’ balance still is off; if the state designed the policy exclusively to maximize academic gains, it would raise the cap in urban areas and lower the cap in non-urban areas. Regardless, it would be inaccurate to state that charter schools at large in Massachusetts positively serve all students; some do and some clearly do not.
The Statistics Become a Debate: Massachusetts’ 2016 Charter Cap Referendum
Massachusetts voters had a say in the charter cap debate when they were offered a referendum in the 2016 election, voting on a proposal that would increase the yearly charter quota by twelve schools.[15] Within that proposal was a stipulation that priority to charter authorization would be given to school districts in the lowest 25% of the state, and the growth in charter school enrollment could not exceed one percent of statewide total enrollment.[16] These stipulations seem reasonably based on the evidence and conclusions drawn earlier in this paper.
Since the ballot initiative was introduced in 2015, the political forces in favor of the cap raise were steady and loud. Beth Anderson, chairwoman of the board of the Massachusetts Charter Public School Association, cited the over 30,000 students on waiting lists in her initial statement, stating that “these families deserve better.”[17] In a state where Anderson had political allies in the governorship and Department of Education under Republicans Governor Charlie Baker and Secretary of Education Jim Peyser, this sentiment was naturally echoed by Massachusetts’ executive branch. Republicans in the state legislature generally fell in line with this position as well.
The political landscape was far more complicated on the Democratic side.[18] Most significantly, the Massachusetts Democratic Party – the state branch of the national party – and many members of state legislature’s Democratic caucus found themselves on opposite sides, with the former advocating against the raise and the latter showing support.[19] In fact, a dramatically visual representation of this split was found at the Democratic National Convention in Philadelphia during the summer of 2016, where Democrats for Education Reform and top pro-raise leaders Senator Michael Rodrigues and Representative Frank Moran hosted several official pro-charter breakfasts, much to the dismay of party leadership itself.[20] The optics of this spectacle, particularly for a nationally-fractured Democratic party, were hardly ideal.
Unsurprisingly, the partial Democratic opposition to the pro-raise movement was bolstered by state teacher unions as well as the national arm of the American Federation of Teachers.[21] In terms of tactics, the pro-raise and anti-raise sides different significantly. The pro-raise side outraised the anti-raise side, accepting sizable donations from Michael Bloomberg and investors in Massachusetts.[22] Money also flowed in from super-PAC-like “dark money” groups like “Strong Economy for Growth” and “Education Reform Now Advocacy.” Much of the over $25 million spent by this side was used for statewide television advertisements.[23] In contrast, the anti-raise side raised most of its funds from unions, but found political capital in the form of powerful endorsements by U.S. Senator Elizabeth Warren[24] and Boston Mayor Martin J. Walsh.[25] The side also drew upon its vast group of teacher supporters, mobilizing them to phone-bank and canvass by the hundreds of thousands.[26]
Ultimately, the referendum to raise Massachusetts’ charter cap was voted down, 62-38%.[27] Once more data is available, an interesting research project would be an analysis of how effective different political tactics were for this referendum, especially because the side that lost still had more funding than the winning side. It would also be interesting to investigate what knowledge the electorate had of the relative performance of the charter cap in terms of progress for vulnerable, urban students, a reality that potentially was lost amid fierce union opposition campaigns.
Looking Forward: A Federal Charter Cap and the Potential for a New National Education Policy
Even though Massachusetts’ 2016 referendum saw national attention, charter caps and quotas are currently a state legislative issue. As the nation continues its sequence of modern comprehensive education policies – first No Child Left Behind, then Race to the Top, then the Every Child Succeeds Act – the potential to get closer to a solution to national school choice debates would be found in a national charter cap. Although speculative at this point, a federal charter cap could include a plan for determining charter authorization based upon city populations, performance of neighborhood school districts, and other metrics like those that Massachusetts’ cap uses.
Precedent for a federal policy as far-reaching as this proposal is found in the way education policies are “enforced” at the federal level: as gauges for funding. Just as Race to the Top used federal funding as a carrot for states to follow, a potential charter cap could also include federal funding in exchange for compliance. At the same time, a comprehensive federal policy that meaningfully incorporates charter schools is likely to find fierce federal union opposition. Similarly, charter management organizations and their powerful government affairs offices would be just as likely to lobby for more flexible and generous authorization allowances to charter schools. Like other comprehensive legislation efforts, such an endeavor would require patience, compromise, and stamina.
Conclusion
No matter the granular details of a potential federal cap, evidence from Massachusetts that a charter cap can help vulnerable students in urban communities is compelling enough to warrant a closer look at an education policy that, yes, includes charter schools while carefully reconciling those charters with their neighborhood public school counterparts, especially in non-urban communities. Both politically and in terms of constitutionality, such a policy would require significant, likely bipartisan cooperation. However, motivated by the principles that fueled both Massachusetts’ cap and this paper – making tangible progress in public education, particularly for lower-income and minority American students – a renewed national focus on education policy should be a priority of the country.
Acknowledgements
I am very thankful that Harvard (the Yale of Massachusetts) has a variety of high-quality academic reports on its state’s public education system; they proved helpful to my own research. I am also thankful to Professor Debs and her course readings; their balance helped me strip some of my own politics out of my analysis in this paper in acknowledging the good that some charter schools are doing. I am finally thankful to my Keurig, which has been making a lot of coffee lately.
Endnotes
[1] John Dewey, “Democracy and Educational Administration,” School and Society 45 (April 3, 1937); 457-67.
[2] “Questions and Answers About Charter Schools,” Massachusetts Department of Education, accessed April 23, 2017, http://www.doe.mass.edu/charter/new/2015-2016QandA.pdf.
[3] “Questions and Answers About Charter Schools”
[4] Michael Fabricant and Michelle Fine, Charter Schools and the Corporate Makeover of Public Education (New York: Teachers College Press), 18.
[5] Chester E. Finn, Jr. and Bruno V. Manno, “A Progress Report on Charter Schools,” National Affairs, 2015.
[6] “Section 89,” The General Court of the Commonwealth of Massachusetts, accessed April 23, 2017, https://malegislature.gov/Laws/GeneralLaws/PartI/TitleXII/Chapter71/Section89.
[7] Leigh Dingerson, “Whose Schools? An Examination of Charter Schools Governance in Massachusetts,” Annenberg Institute for School Reform at Brown University, 2016, accessed April 23, 2017, http://www.annenberginstitute.org/sites/default/files/product/859/files/WhoseSchoolsRevised.pdf.
[8] “Questions and Answers About Charter Schools”
[9] “Massachusetts Charter School Fact Sheet,” Massachusetts Department of Education, accessed April 23, 2017, http://www.doe.mass.edu/charter/factsheet.pdf.
[10] Kate Taylor, “At a Success Academy Charter School, Singling Out Pupils Who Have ‘Got to Go’,” New York Times, October 29, 2015, accessed April 30, 2017, http://nyti.ms/1kdOsXW.
[11] “Questions and Answers About Charter Schools”
[12] Thomas Kane, “Let the Numbers Have Their Say: Evidence on Massachusetts’ Charter Schools,” Harvard Graduate School of Education, 2016, accessed April 26, 2017, https://cepr.harvard.edu/files/cepr/files/evidence-ma-charter-schools.pdf.
[13] Kane, “Let the Numbers Have Their Say: Evidence on Massachusetts’ Charter Schools”
[14] Kane, “Let the Numbers Have Their Say: Evidence on Massachusetts’ Charter Schools”
[15] Kimberly Hefling, “Democrats feud over charter schools in Massachusetts,” Politico, November 7, 2017, accessed April 30, 2017, http://www.politico.com/story/2016/11/democrats-divided-on-mass-charter-school-expansion-230888.
[16] Shira Schoenberg, “Ballot initiative would grow charter schools in Massachusetts,” MassLive, August 7, 2015, accessed April 27, 2017, http://www.masslive.com/politics/index.ssf/2015/08/ballot_initiative_would_grow_c.html.
[17] Schoenberg, “Ballot initiative would grow charter schools in Massachusetts”
[18] Nina Rees, “Lift the Cap on Charter Growth,” U.S. News, September 6, 2016, accessed April 30, 2017, https://www.usnews.com/opinion/articles/2016-09-06/lift-the-artificial-limit-on-charter-schools-in-massachusetts.
[19] Shira Schoenberg, “30 Massachusetts mayors oppose raising charter school cap: Why?” MassLife, October 26, 2016, accessed April 30, 2017, http://www.masslive.com/politics/index.ssf/2016/10/mayors_oppose_raising_charter.html.
[20] Andy Metzger, “Mass. Democrats Vote to Oppose Charter School Question,” WBUR, August 17, 2016, accessed April 27, 2017, http://www.wbur.org/edify/2016/08/17/mass-democrats-charter-school.
[21] Alan Singer, “Massachusetts Is Ground Zero In Battle Over Charter Schools,” Huffington Post, October 13, 2016, accessed April 30, 2017, http://www.huffingtonpost.com/alan-singer/massachusetts-is-ground-z_b_12467160.html.
[22] Valerie Strauss, “An extraordinary battle over charter schools is consuming this state,” Washington Post, November 7, 2016, accessed April 30, 2017, https://www.washingtonpost.com/news/answer-sheet/wp/2016/11/07/an-extraordinary-battle-over-charter-schools-is-consuming-this-state/?utm_term=.0fa16e8b6063.
[23] Paul Heroux, “Don’t Raise The Massachusetts Charter Cap Just Yet,” Huffington Post, October 15, 2016, accessed April 30, 2017, http://www.huffingtonpost.com/paul-heroux/dont-raise-the-massachuse_b_12502860.html.
[24] Joan Vannochi, “Warren weighs in on charter schools,” Boston Globe, November 1, 2016, accessed April 30, 2017, https://www.bostonglobe.com/opinion/2016/09/28/warren-weighs-charter-schools/dCWSjDFl69FgziCPo3HCkO/story.html.
[25] Valerie Strauss, “Elizabeth Warren comes out against raising cap on charter schools in Massachusetts,” Washington Post, September 27, 2016, accessed April 30, 2017, https://www.washingtonpost.com/news/answer-sheet/wp/2016/09/27/elizabeth-warren-comes-out-against-raising-cap-on-charter-schools-in-massachusetts/?utm_term=.3efed9e6e5f2.
[26] David Scharfenberg, “Mass. voters reject ballot question on charter schools,” Boston Globe, November 8, 2016, accessed April 27, 2017, https://www.bostonglobe.com/metro/2016/11/08/charter/v34OA3vMI8dRABDsFc4JuM/story.html.
[27] Scharfenberg, “Mass. voters reject ballot question on charter schools”
Bibliography
Dewey, John. “Democracy and Educational Administration.” School and Society: 457-67. 1937.
Dingerson, Leigh. “Whose Schools? An Examination of Charter Schools Governance in Massachusetts.” Annenberg Institute for School Reform at Brown University, 2016. Accessed April 23, 2017. http://www.annenberginstitute.org/sites/default/files/product/859/files/WhoseSchoolsRevised.pdf.
Fabricant, Michael, and Michelle Fine. Charter Schools and the Corporate Makeover of Public Education. New York: Teachers College Press. 2012.
Finn, Chester E., and Bruno V. Manno. “A Progress Report on Charter Schools.” National Affairs, 2015.
Hefling, Kimberly. “Democrats feud over charter schools in Massachusetts.” Politico, November 7, 2016. Accessed April 30, 2017. http://www.politico.com/story/2016/11/democrats-divided-on-mass-charter-school-expansion-230888.
Heroux, Paul. “Don’t Raise The Massachusetts Charter Cap Just Yet.” Huffington Post, October 15, 2016. Accessed April 30, 2017. http://www.huffingtonpost.com/paul-heroux/dont-raise-the-massachuse_b_12502860.html.
Kane, Thomas. “Let the Numbers Have Their Say: Evidence on Massachusetts’ Charter Schools.” Harvard Graduate School of Education, 2016. Accessed April 26, 2017. https://cepr.harvard.edu/files/cepr/files/evidence-ma-charter-schools.pdf.
Massachusetts Department of Education. “Massachusetts Charter School Fact Sheet.” Accessed April 23, 2017. http://www.doe.mass.edu/charter/factsheet.pdf.
Massachusetts Department of Education. “Questions and Answers About Charter Schools.” Accessed April 23, 2017. http://www.doe.mass.edu/charter/new/2015-2016QandA.pdf.
Metzger, Andy. “Mass. Democrats Vote to Oppose Charter School Question.” WBUR, August 17, 2017. Accessed April 27, 2017. http://www.wbur.org/edify/2016/08/17/mass-democrats-charter-school.
Rees, Nina. “Lift the Cap on Charter Growth.” U.S. News, September 6, 2016. Accessed April 30, 2017. https://www.usnews.com/opinion/articles/2016-09-06/lift-the-artificial-limit-on-charter-schools-in-massachusetts.
Scharfenberg, David. “Mass. voters reject ballot question on charter schools.” Boston Globe, November 8, 2016. Accessed April 27, 2017. https://www.bostonglobe.com/metro/2016/11/08/charter/v34OA3vMI8dRABDsFc4JuM/story.html.
Schoenberg, Shira. “Ballot initiative would grow charter schools in Massachusetts.” MassLife, August 7, 2015. Accessed April 27, 2017. http://www.masslive.com/politics/index.ssf/2015/08/ballot_initiative_would_grow_c.html.
Schoenberg, Shira. “30 Massachusetts mayors oppose raising charter school cap: Why?” Mass Life, October 26, 2016. Accessed April 30, 2017. http://www.masslive.com/politics/index.ssf/2016/10/mayors_oppose_raising_charter.html.
Singer, Alan. “Massachusetts Is Ground Zero In Battle Over Charter Schools.” Huffington Post, October 13, 2016. Accessed April 30, 2017. http://www.huffingtonpost.com/alan-singer/massachusetts-is-ground-z_b_12467160.html.
Strauss, Valerie. “An extraordinary battle over charter schools is consuming this state.” Washington Post, November 7, 2016. Accessed April 30, 2017. https://www.washingtonpost.com/news/answer-sheet/wp/2016/11/07/an-extraordinary-battle-over-charter-schools-is-consuming-this-state/?utm_term=.0fa16e8b6063.
Strauss, Valerie. “Elizabeth Warren comes out against raising cap on charter schools in Massachusetts.” Washington Post, September 27, 2016. Accessed April 30, 2017. https://www.washingtonpost.com/news/answer-sheet/wp/2016/09/27/elizabeth-warren-comes-out-against-raising-cap-on-charter-schools-in-massachusetts/?utm_term=.3efed9e6e5f2.
Taylor, Kate. “At a Success Academy Charter School, Singling Out Pupils Who Have ‘Got to Go’.” New York Times, October 29, 2015. Accessed April 30, 2017. http://nyti.ms/1kdOsXW.
The General Court of the Commonwealth of Massachusetts. “Section 89.” Accessed April 23, 2017. https://malegislature.gov/Laws/GeneralLaws/PartI/TitleXII/Chapter71/Section89.
Vennochi, Joan. “Warren weighs in on charter schools.” Boston Globe, November 1, 2016. Accessed April 30, 2017. https://www.bostonglobe.com/opinion/2016/09/28/warren-weighs-charter-schools/dCWSjDFl69FgziCPo3HCkO/story.html.