
This exercise will take you through collecting, interpreting and visualizing Office of Civil Rights Data for New Haven in order to answer the following 2 questions:
- How does enrollment in advanced placement (AP) courses vary by race and socio-economic status in New Haven public high schools?
- How does enrollment vary by school and across schools?
Please record your answers in a word document with your name clearly labeled at the top. You may work with a partner. If so, make sure that you and your partners names are clearly labeled at the top. Each one of you should upload a copy of the assignment to Canvas.
To complete the data exercise, please answer the questions listed below in bold.
Part I: Overview of the Civil Rights Data collection
- Go to http://ocrdata.ed.gov/ and read the FAQs (Frequently Asked Questions.)
- Write down 1-2 sentences total: Why does the government collect this data? Why do they focus on certain indicators? How do they make use of it?
Part II: Data Overview & Trends for the New Haven Schools
- Go to http://ocrdata.ed.gov/DistrictSchoolSearch, and select the tab for “Find District.”
- Select Connecticut and find District.
- Select New Haven School District
- Select from several of the reports on the right tab. Select the “Equity Report”
- Reading through the chart, what is the total number of New Haven high school students enrolled in schools that offer AP/IB (you can find this as the “n” (meaning number) for total schools in the figure on Advanced placement)? ______________
- How many students total enroll in AP courses in New Haven?______
- How many students total enroll in Calculus in New Haven high schools? _______
- How many students total enroll in Physics in New Haven high schools? ______
- Comparing the enrollment in AP, Calculus and Physics in comparison with the overall high school enrollments by race and ethnicity, what pattern do you observe? (1 sentence)
Part III: Downloading & creating summary statistics via tables and figures
How does advanced coursework enrollment vary at New Haven high schools?
- Go to http://ocrdata.ed.gov/flex/Reports.aspx?type=school
- Select “New Haven” in City, Connecticut in State and 2013 for year. (You don’t want to get New Haven, MO in your data!) Why might we want to select New Haven in “city” versus “district?”
- Look over the data in “Choose your data” – Note down in 1-2 sentences: why do you think these various data points are part of the Office of Civil Rights data?
Making a downloadable data chart
- In choose your data, let’s select “Advanced Placement Course and Test Taking”
- Check your data: Your first school should be Achievement First, and your top entry: Enrollment in AP Classes for American Indian or Alaska Native should be 0.
- Select Export format: Excel 2003 & download to your computer. Let’s call it NH.APdata.2013 Open up in Excel (or you can cut and paste it to Google sheets).
- Simplify the data. We will be focusing first on one line of data – “Enrollment in AP Courses”.
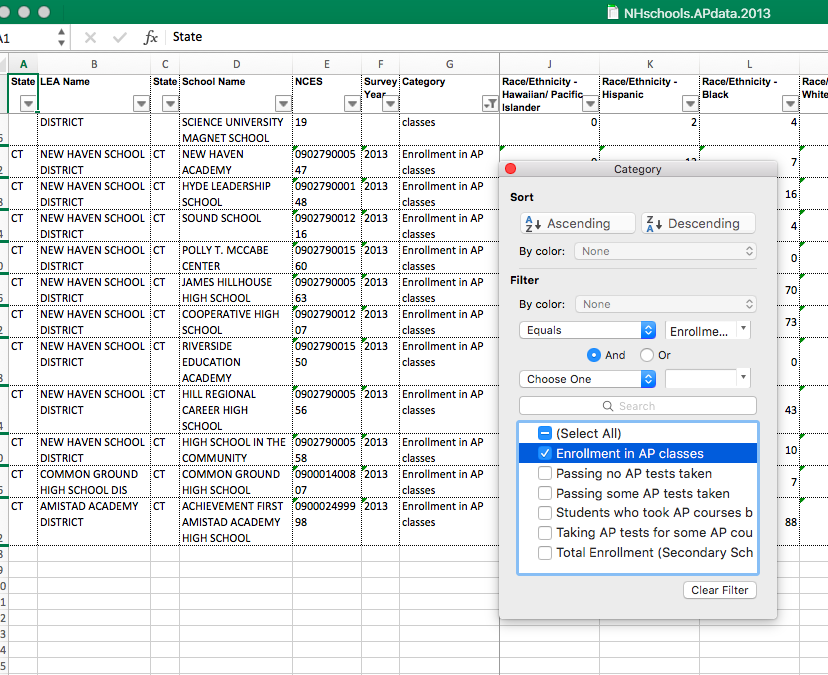
- In the toolbar, select Data, and then select Filter.. This should give you tabs for each column.
- Sort in Category and change from “Select all” to selecting “Enrollment in AP Classes.”
- Make the first copy of your data which we will modify. Select copy of your selected rows, and then select “Paste Special” and select Values. Pasting values ensures that you don’t copy any formulas or embedded formatting from previous excel documents. Let’s call this new excel document NH.APdata.2013.modified (Always save your original unmodified data!)
- Let’s clean up the data. Delete the first columns State, LEA (District), State, Year, Total AP and the column with ID (the NCES number).
- Select Filter data, and organize the table by school name, A to Z. Achievement First should be first
- Let’s further simplify and clean up the data. Change column headings to delete out “Race Ethnicity”
- Copy the data table into your word document. You may need to format it a little – highlight the table and select Autofit to contents. Reduce the size of your font to size 8, so that all of the numbers can be in the same column. Add a title at the top: Table 1: New Haven High School AP Enrollment by Race 2013
Your chart should look something like this.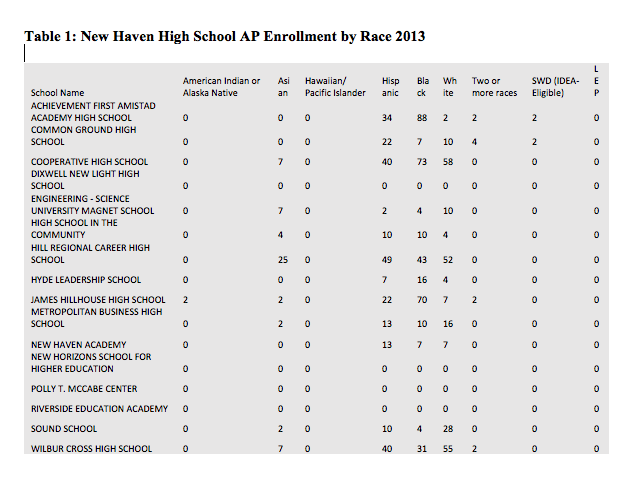 Congratulations! You have created a data table that you might include in a research paper.
Write 2-3 sentences analyzing what you observe in trends in AP enrollment across these New Haven schools.
- To make our visualization, let’s further simplify and clean up the data. Schools or columns with zeros are significant, and tell a story, but clutter up a visualization. First, delete out rows (entire row) for schools with 0 students enrolled in AP classes. Check your work: You should have deleted Dixwell New Light, New Horizons, Polly McCabe, Riverside. Hawaiian/Pacific Islander and Limited English Proficiency have zero enrollments, so let’s delete these as well.
- Paste this data in a new file (using paste values) – you can call it NH.APdata.2013.modified2 Check your work: you should now have 13 rows of data.
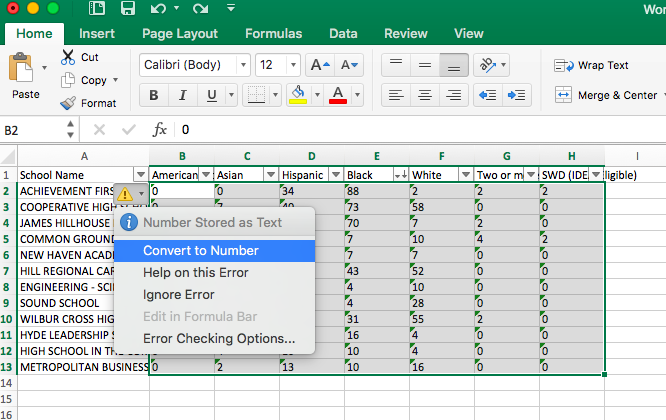
- You may see small green triangles in the upper-left corners of your cells. For some reason, the data downloaded from the Office of Civil Rights configures the numbers as texts. We need to tell excel to read the numbers as numbers. Highlight the number cells and when you get a yellow error message, select “Convert to Number.”
Now we are ready to make the visualization – a segmented bar chart.
4. To best show the data, let’s put the columns with the largest number of students first – move Hispanic, Black and White to be columns B, C and D.
5. Next, filter Hispanic in descending order, so that the school with the largest number of AP students is at the top. Check your work: it should be Hill Regional Career.
6. Next, highlight your work, select Insert and Stacked Column.
7. Stretch out the column so that the numbers are clearer to read.
8. Insert a chart title, and X and Y axis labels. Your table should look something like this:
Figure 1: New Haven School AP Enrollment (2013)
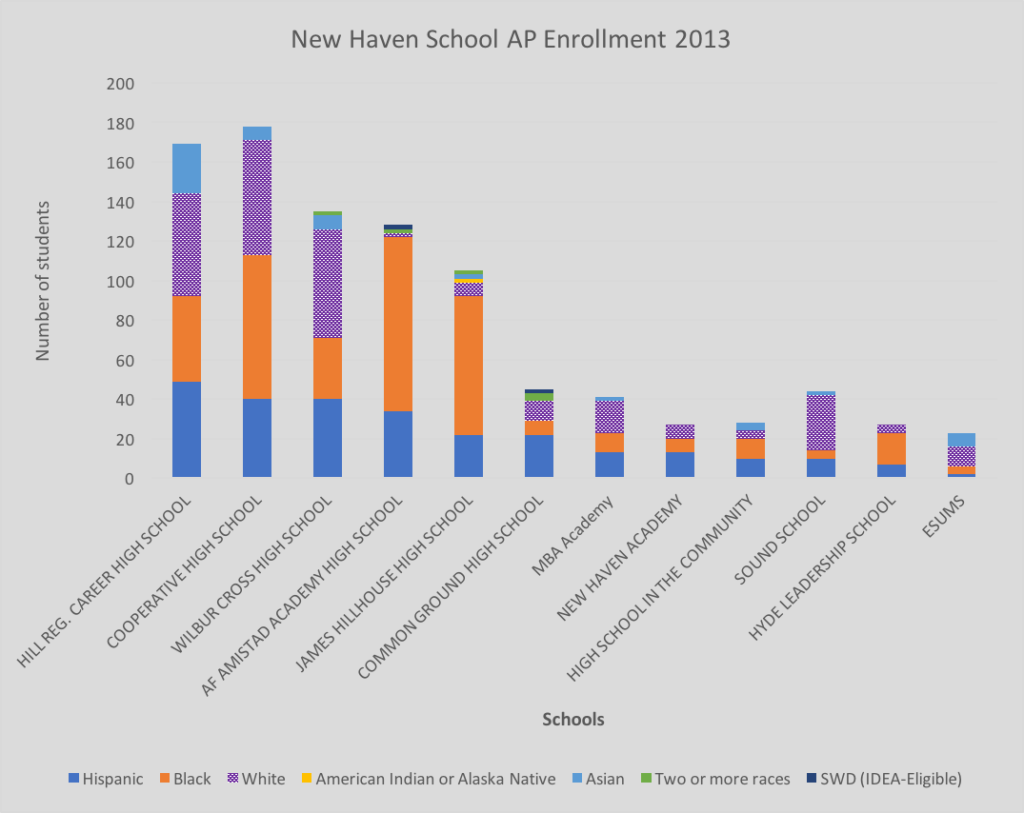
9. Write 1-2 sentences reflection about what the visualization shows, and what is missing. What further analysis or context might we need to know to get a fuller picture of the data?
Congratulations! You have now downloaded government data, created data tables and made a segmented bar chart data visualization. This is an important skill that you will be able to use in your final research project for this class. You are able to do summary statistics! Congratulations!
Please upload your word document with answers, table and figure to Canvas. Remember to include your name and your partner’s names on the assignment.