By George Huynh
Executive Summary:
Nowadays, Asian Americans are vastly underrepresented in the media and in the public sphere. The same phenomenon seems to exist in the education world, whereby there are very few Asian American K-12 teachers and administrators. This policy brief recommends (1) implementing more teacher recruitment programs and scholarships that target Asian Americans and Pacific Islanders (AAPI), (2) increasing positive representation of AAPI in the education sphere, and (3) improving the respectability of careers in teaching. If we are committed to diversifying the workforce, we ought to look harder at our current teacher diversity initiatives.
Introduction:
There was a time over two decades ago when teacher diversity was a topic of serious discussion and concern throughout the United States (NEA, 2014). However, those conversations have been overshadowed almost completely by discussions about school choice, standardized testing, curriculum content, and order and discipline (Education World, 2017). While the biggest priority for our country’s students and parents, of course, ought to be to recruit as many qualified teachers as possible into the teaching profession to ameliorate the teacher shortage crisis, it’s apparent that there exists an extreme lack of Asian American teachers.
Some Asian Americans like Michelle Rhee and Tommy Chang, both products of the illustrative Teach For America program, have been able to rise to stardom as exemplary superintendents in their respective cities. However, they are but exceptions in a system that has failed to elevate Asian American faces and voices.
So why exactly are there not more Asian American figures in the public realm, and specifically public education? Hopefully, the research below will present why this is currently the case, and what can be done to correct it. The feasibility of creating more teacher recruitment programs aimed at AAPI and increasing positive images of Asian American teachers in the workforce will be explored in this policy brief.
Background:
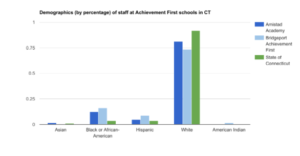
As America continues to diversify, the diversity within public school teachers has been unable to reflect that trend. Joseph Williams (2015) writes, “While the diversity of the nation’s public school student body has exploded in the last few decades, the number of African American, Latino, and Asian teachers hasn’t kept pace—despite state and federal programs designed to draw more minorities into the profession.” A Center for American Progress Survey revealed that a whopping 82 percent of public school teachers are white, in contrast to 17 percent composed of African Americans, Latinos, and Asian Americans (Dilworth & Coleman, 2014).
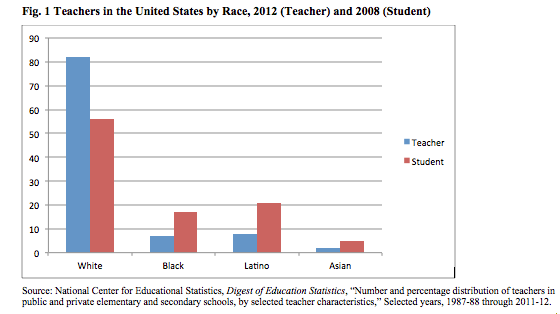
As reflected in the graph above, the gap between the racial makeup of America’s public schools and the people who lead their classrooms has reached unprecedented levels (Kardish, 2015). In the 2010 U.S. Census, 5.6 percent of respondents noted that they were of Asian descent (U.S. Census, 2010), whereas only 1.5 percent of American teachers are Asian today (TFA, 2017). Given that it’s been over seven years since this census data was taken, and Asians continue to be the fastest growing population in the country, it can be assumed that Asian Americans are underrepresented by more than four times their national proportion.
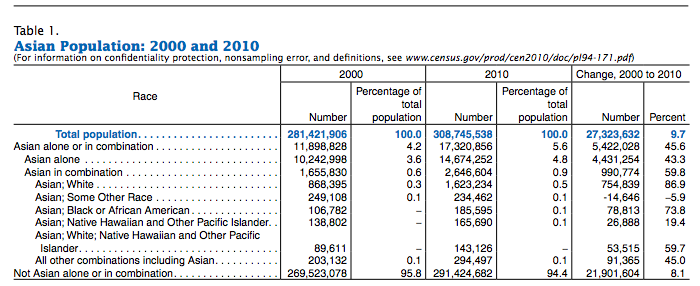
Retrieved from the 2010 U.S. Census
The Asian American Achievement Paradox written by Jennifer Lee and Margaret Zhou (2015) does a great job of diagnosing the problem of Asian American teacher recruitment, by supplying information about the historical sociocultural reasons for why Asian Americans as a conglomerate do not find teaching attractive. Suspected barriers to entry in the teacher profession include the sociocultural expectations that Asian Americans face, including but not limited to the model minority myth, long-standing legacies of exclusion (from not only the country but also citizenship) based on racism, and tendencies to enter STEM-related fields. The paradox here, lies in the fact that while Asian Americans value receiving a strong education, they are very rarely on the other side educating the next generation of students and leaders (United Nation, 2001).
Although minority teacher recruitment has steadily improved over the years, retention has been less than stellar (NEA, 2017). This research attempts to answer why there are not more Asian Americans in the public education sphere in situating the current teacher climate for Asian Americans in the U.S., which has been on the decline since the early 1990s (Rong and Preissle, 1997). It is concerning that the proportion of teachers who are Asian American still does not match the population of Asian American students in this country today, even with this problem identified two decades ago. It is a shame that Asian Americans do not compose more of the education workforce, but fortunately there are rather simple actions that can be taken to change this downward trend.
Evidence, Data, and Proposals:
On their website, Teach For America lists the Asian American and Pacific Island Initiative under a tab labeled “Our Initiatives,” with the following information:
“Less than 1.5 percent of our nation’s teachers identify as AAPI – a number that does not reflect the percentage of AAPI students or the changing student demographics in our schools. More than 4 percent of our student population identify as AAPI. The AAPI community is also the fastest-growing racial group in the United States—representing more than 48 ethnicities, over 300 spoken languages, varied socioeconomic status, and distinctions across immigration history, generational status, culture, and religion.”
Even more striking, according to a National Education Association report by Dilworth and Coleman (2014), is the fact that about 0.5% of America’s teachers—about one-third of all Asian teachers—are male.
Below the aforementioned description is a video of Kaycee Gerhart, an AAPI TFA alumna, reflecting on her experience as an AAPI teacher:
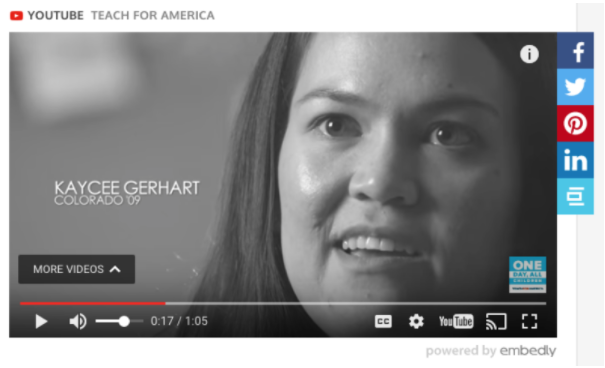 Retrieved from teachforamerica.org
This video’s purpose is quite valuable, in presenting a personal account from an alum who has experienced firsthand positive student reactions from learning in a classroom with a teacher who identified as AAPI. Right above the video on their website are images of a diverse group of AAPI TFA fellows who look much different from Gerhart.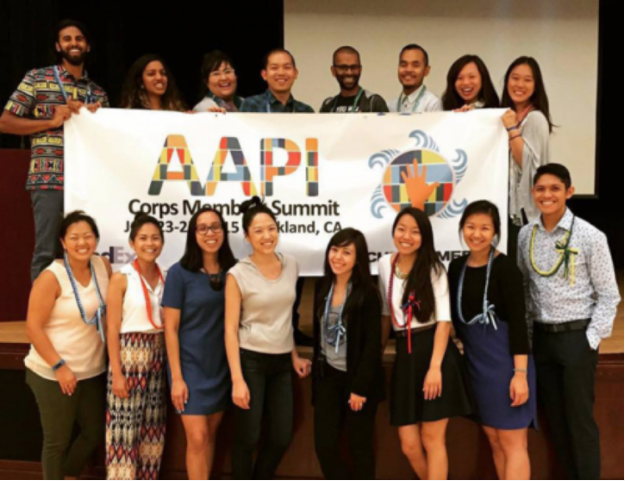 Retrieved from teachforamerica.org
TFA’s mission is to be fully representative of Asian Americans, as they attempt to encompass a smaller subset of AAPI, specifically Amerasians. Since Gerhart does appear partially white, this video really might in fact help dismantle many of the harmful stereotypes and perceptions of Asian Americans that currently exist in the mainstream. considering that as of 2010, about 14.7 million people identified as Asian alone in the census, whereas 2.6 million Asian Americans identified as Asian in combination, or mixed with another race (U.S. Census, 2010). Having more accurate, positive representation of all Asian Americans would help American citizens embrace this group of individuals and their diverse backgrounds more readily, and more importantly, encourage other Asian Americans to join the teaching force.
This cause, launched in 2014 by TFA, could be emulated by other teacher recruitment programs such as the Office of Human Capital (OHC) at Boston Public Schools (BPS). They boast on the BPS Website (2017), “The OHC Recruitment team works to attract a qualified and diverse pool of candidates from which principals can hire. Their efforts range from participating in career fairs to developing a number of pathways to teaching with local universities.” I absolutely think that even a small, simple message like this ought to be stressed during the teacher search process, and acts as encouragement for teachers of color to pursue a career in education, especially as a teacher. A simple nudge like this would increase the amount of minority teachers overall, in turn lifting up the amount of Asian American teachers. Although there are many programs that declare a commitment to diversity on paper but diverge from their stated mission in practice, even a small mission statement such as the aforementioned one can be extremely valuable. Although the Boston Public Schools district does a relatively good job of recruiting teachers of color, they are not necessarily experts at retaining them, as attrition rates are rather high. For example, in 2015, BPS “filled over 40% of their vacancies with candidates of color, while at the national level, teachers of color comprise just 17% of the total workforce” (Maffai, 2015). Even in a progressive city like Boston are teachers of color leaving the education workforce at an alarming rate (Gleason, 2014). While Gleason focuses on the struggles of black teachers, some of the problems they face are relevant to Asian American teachers—particularly that their high attrition rates result from feeling isolated and furthermore, stereotyped by white teachers and their students. Many minority teachers cite poor working conditions and low pay as two of the biggest reasons why they leave the teaching profession (Ingersoll & May, 2016). In order for them to stay, states should invest more into their human capital systems and truly make diversity in the public school classrooms a priority (Konoske-Graf et al., 2015). The teachers of color recruited by the various programs that do exist would benefit tremendously coupled with mentorship programs (Ingersoll & May, 2004). Instead of a simple electronic message on a website, Asian American teachers would thrive under consistent guidance from colleagues their age as well as more experienced teachers.
With so little representation of AAPI folks in the media, it would be beneficial to have more accurate visuals of AAPI in the mainstream. Although Asian Americans are quite visible in STEM fields, they are hardly seen in Hollywood or on television (Hess, 2016). On the other hand, when they are presented on screen, there tend to be restrictive and unbalanced portrayals of Asians (MANAA, 2017). They are often represented as dragon ladies, Kung Fu masters, effeminate geeks, foreigners, and prostitutes, despite the good intentions of individual producers and filmmakers (Nittle, 2016). In order to expand what it means to be an Asian American in the United States, a massive media campaign should be launched in order to place Asian Americans, in advertisements on the television screen and on highway billboards, dressed as teachers, construction workers, doctors, nurses, lawyers, politicians, professors, writers, poets, musicians, athletes, and everything in between.
Beyond just increasing favorable representation of AAPI in the media, establishments should seek to increase the prestige and respectability of the teaching profession. Some steps that could be taken include the creation of a national teaching university (Chu & Roberts, 2017). This would bolster the idea that teaching is a specialization that requires more than just a few weeks of training to do. For example, an alternative certification program such as TFA mandates only five weeks of training before entering the workforce as a full-time teacher, overwhelming often times the unprepared recent college graduate with no previous teaching experience (Ahmad & Boser, 2014). Creating this university would place the status of teachers closer to those of doctors and lawyers, which require years of postgraduate education to obtain. Specific to Asian Americans, who particularly enjoy bragging to their friends about the professional careers of their children, boosting not only the reputation, but also the salary of teachers would trickle in many more Asian Americans interested in teaching (Lee & Zhou, 2015). Perhaps this would be effective in breaking the minority myth and stereotype double threat/promise which work in conjunction to limit Asian Americans’ perceptions of what they are capable of doing and ought to do for a living.
Conclusion:
One alternative to recruiting Asian American teachers is implementing teacher programs predicated towards the new trend in diversity & inclusion that attempt to educate teachers from different backgrounds about what to expect about the environment that they live in (Feng, 1994). Although this mutual cultural understanding will help ameliorate some of the struggles Asian American students face, it won’t place role models who look like them in the classroom, and allow them to smash the “bamboo ceiling” that has limited them to mild success in their respective careers (Lee and Zhou, 2015). Current teaching programs in place ought to expand their underrepresented minority recruitment and retention initiatives in order to help bring teachers into the classroom and help struggling Asian American students excel in the classroom by providing a role model to whom they can relate. Besides building a pipeline to teaching, they should be supported along the way with scholarship money and strong mentorship programs that will provide incentives for them to enter and remain in the teacher profession. While it will take a lot of funding and a multidimensional effort to address an issue that has become so ingrained in America’s infrastructure, it’s worth the time and energy because the future of America’s children matters, and all students deserve to learn from teachers who reflect their population.
Acknowledgements:
I’d like to thank my friends Emma Dinh and Thanh Tran for keeping me company, my roommate Jacob Mitchell, for supporting me during my struggles, and all my colleagues who have heard me rant about things concerning education policy and also things completely unrelated to education policy. Last but not least, I would also like to thank Professor Mira Debs for her engagement and support throughout an awesome semester in her Public Schools and Public Policy course.
Word Count: 2574
Works Cited
Ahmad, F. Z. & Boser, U. (May 2014). Retrieved April 28, 2017, from https://www.americanprogress.org/wp-content/uploads/2014/05/TeachersOfColor-report.pdf
Chu, T. & Roberts, W. (2017, May 3). The Opposite of TFA: A National Teacher University to Build the Teaching Profession. Retrieved May 3, 2017, from debsedstudies.org
Dilworth, M. and Coleman, M. (May 2014). Time for a Change in Diversity in Teaching Revisited. Retrieved April 28, 2017, from www.nea.org/assets/docs/Time_for_a_Change_Diversity_in_Teaching_Revisited_(web).pdf
Education World. (2017, May 3). Teachers Talk About Public Education Today. Retrieved May 3, 2017, from http://www.educationworld.com/a_curr/curr035.shtml
Feng, J. (June 1994). Asian American Children: What Teachers Should Know. Retrieved April 29, 2017, from https://www.ericdigests.org/1994/teachers.htm
Hess, A. (2016, May 29). Asian-American Actors Are Fighting for Visibility. They Will Not Be Ignored. Retrieved April 28, 2017, from https://www.nytimes.com/2016/05/29/movies/asian-american-actors-are-fighting-for-visibility-they-will-not-be-ignored.html
Ingersoll, R. M. & May, H. (2004, March 1). Do Teacher Induction and Mentoring Matter? Retrieved April 26, 2017, from http://repository.upenn.edu/cgi/viewcontent.cgi?article=1134&context=gse_pubs
Ingersoll, R. M. & May, H. (September 2011). The minority teacher shortage: Fact or fable? Retrieved April 17, 2017, from Public Schools & Public Policy Canvas file page.
Ingersoll, R. M. & May, H. (2016, September 15). Minority Teacher Recruitment, Employment, and Retention: 1987 to 2013. Retrieved April 29, 2017, from https://learningpolicyinstitute.org/product/minority-teacher-recruitment-brief
Kardish, C. (March 2015). The Classroom Racial Gap Hits An All-Time High. Retrieved April 27, 2017, from http://www.governing.com/topics/education/gov-racial-gap-teacher-students.html
Konoske-Graf, A., Partelow, L. & Benner, M. (2016, December 22). To Attract Great Teachers, School Districts Must Improve Their Human Capital Systems. Retrieved April 27, 2017, from https://www.americanprogress.org/issues/education/reports/2016/12/22/295574/to-attract-great-teachers-school-districts-must-improve-their-human-capital-systems/
Lee, J. & Zhou, M. (February 2015). Asian American Achievement Paradox. Retrieved April 17, 2017, from Public Schools & Public Policy Canvas file page.
Maffai, T. (2015, October 21). How Do We Build a Truly Diverse Teacher Workforce?Retrieved April 28, 2017 from https://brightreads.com/how-do-we-build-a-truly-diverse-teacher-workforce-20d77956f3f9
Media Action Network for Asian Americans (MANAA). (2017). Retrieved April 28, 2017, from www.ntac.hawaii.edu/AAPIcourse/downloads/pdf/readings/AsianAmericaStereotypes.pdf
National Center for Educational Statistics. (2012). Number and percentage distribution of teachers in public and private elementary schools and secondary schools, by selected teacher characteristics. Retrieved May 2, 2017, from https://www.nea.org/home/65429.htm
National Education Association. (2017). Retrieved April 28, 2017, from http://www.nea.org/home/29031.htm
Neason, A. (2014, December 17). Retrieved April 27, 2017 from http://www.slate.com/blogs/schooled/2014/12/17/teacher_diversity_accomplishing_it_is_not_just_about_recruitment_it_s_about.html
Nittle, N. (2016, March 1). Why These 5 Asian American Stereotypes in TV and Film Need to Die. Retrieved May 1, 2017, from https://www.thoughtco.com/asian-american-stereotypes-in-t-film-2834652
Teach For America. (2017) Retrieved April 27, 2017 from https://www.teachforamerica.org/about-us/our-initiatives/asian-american-pacific-islander-initiative
United Nations. (2001, May 3-4). Asians in the U.S. Public Service: Diversity, Achievements, and Glass Ceiling. Retrieved May 3, 2017, from http://unpan1.un.org/intradoc/groups/public/documents/UN/UNPAN000869.pdf
U.S. Census. (2010). Asian Population Data. Retrieved from https://www.census.gov/prod/cen2010/briefs/c2010br-11.pdf
Williams, J. (2015, March 3). America’s Kids Are Getting More Diverse But Not Its Teachers. Retrieved April 27, 2017 from http://www.takepart.com/article/2015/03/03/americas-kids-getting-more-diverse-but-not-its-teachers


 https://images.washingtonpost.com/?url=http://img.washingtonpost.com/blogs/answer-sheet/files/2014/03/salaries.png&w=1484&op=resize&opt=1&filter=antialias