Low Income, High Success: Economically Disadvantaged Students at two Connecticut Public Schools

Executive Summary

Under No Child Left Behind (NCLB) and Race To The Top (RTTT), raising student achievement (as measured by standardized assessments) and attainment (as gauged by outcomes such as graduation and postsecondary success) have become national priority. Researchers and policymakers have realized many barriers to the success of different student subgroups, in particular students from low-income backgrounds. A combination of factors—insufficient academic preparation, undeveloped social networks, lacking information, low expectations, and school culture, among others—contribute to persisting gaps between lower-income students and their higher-income peers. 

What can schools do to counteract these problems? To answer this question, I develop a brief case study of schools that already are successful in doing so. The underlying purpose of this review is simple in nature:

  • Identify schools where low-income students do very well at the secondary level, and subsequently enroll and persist in college at high rates;
  • Identify what elements of these schools might contribute to this success, and
  • Make recommendations commensurate with the scope and limitations of this report about (a) where these schools might have room to improve and (b) how practices from these schools can inform policy elsewhere.

Introduction

The goal of NCLB was clear: erase the “soft bigotry of low expectations” and ensure that all children could succeed.1 Its goals were arguably unrealistic and its impacts on schools far from its intentions, but its core message was strong: work for the success of all students, and don’t settle for low expectations or excuses for underachievement. Under RTTT, this idea emerged in the form of universal access to higher education and college/career readiness.2

The push for widespread college attendance predated both the W. Bush and Obama administrations, and over the past few decades, there has been significant progress toward the goal of postsecondary equity in some regards. Of 1980 high school sophomores from the lowest family income quartiles, 52% reported not enrolling in college within 8-10 years of the expected time of completing high school, which fell to 28% for 2002 sophomores.3 The National Center for Education Statistics (NCES) reports that the percentage of bottom-income-quintile students who enrolled in college recently after graduating high school reached a historic high of 69% in 2015. According to its dataset, this statistic has been incredibly volatile in recent years; in 2007, it reached 58%, but fell to 45% in 2013, only to rebound to the 2015 high.4

However, not all indicators are so positive. The College Board reports declining representation of undergraduate Pell-Grant recipients in college since the 2011-12 term (Pell grants are intended to assist low-income students pay for college).5 Based on work by Ikoma & Broer (2015), who analyzed data on students from the High School Longitudinal Survey (HLS), more than 95% of high school freshmen from the lowest socioeconomic quartile (SEQ) in 2009 looked to eventually earn a bachelor’s degree. By 2013, a very different picture emerged: only 43% of high-achieving students and fewer than 30% of low-achieving students from the bottom quartile were enrolled in a baccalaureate program. Interestingly, more low-achieving students from the top SEQ (58%) entered into such programs by 2013 than did high-achieving students from the bottom quartile.6 Of course, not all students enroll in college immediately upon the close of high school, and it is possible that these gaps close in the years following the end of their secondary education. For example, according to NCES, 63% of students from the lowest income quintile (compared with 83% from the highest income quintile) enrolled in college within a year of graduating from high school or completing a GED—still a large gap, but not to the extent seen in Ikoma & Broer’s analysis.4

In any case, the fact that stark inequities in postsecondary accessibility persist between different socioeconomic groups has drawn the attention and action of researchers, educators, and policymakers attempting to find solutions. It has also become clear that examining accessibility for individual subgroups in isolation from their school context is not enough. Students from lower-income backgrounds, as well as students who attend schools/districts with higher concentrations of poverty, are less likely to persist from the first to second year of college.7, 8 Getting students to enroll in college is necessary but not sufficient for postsecondary success.

Literature Review

We want to identify what can be changed in order to improve the postsecondary success of disadvantaged students. There are a number of relevant factors in across domains:

Figure 1: different inputs/cause variables and outcomes/effect variables in the educational process. Not displayed here is how the different inputs mutually affect one another.

Many of the causes of different academic outcomes might initially seem outside of the control of high schools. Parents, home environment, student finances, student beliefs and behaviors, and peer interactions have deep impacts on student aspirations and values. However, many of these variables are not so far removed from the traditional school as we may think. Student beliefs and values are influenced by peers and cultural norms, but also by school; parents can be engaged in the school community when educators make efforts to accommodate and interact with them. Even families who typically do not have much time or opportunity to engage in education can find ways to be involved in their children’s academics with the help of school resources and initiatives.9 Then it becomes paramount for policymakers, educators, and school leaders to know how their institutions can best design their practices and services at the secondary level to maximize postsecondary student success, especially for underrepresented groups.

Academic preparation. Some relatively simple features of educational attainment in high school, such as grades and mathematics course taking, serve as some of the strongest predictors of college success. It has been shown that strong academic preparation in high school can narrow gaps in college persistence between first-generation students and their peers. Unfortunately, students from low-income backgrounds tend to be less ready for college, in part because their schools often lack the resources and course offerings to properly prepare them.10

Social interactions/environments. While academics are at the front of college readiness, beneath students’ academic preparation is a web of social interactions and experiences that may be just as important. Unfortunately, low-income students are less likely than more affluent peers to be immersed in secondary school environments that encourage open interaction between them and their peers and teachers, both inside and outside of class. As a result, they are less prepared to capitalize on support services and to ask for help when they need it.11, 12 Anthony Abraham Jack describes this in the context of the “doubly disadvantaged” and the “privileged poor:” the latter group, consisting of low-income students who happen to attend elite high schools, benefits from smoother (if not instantaneous) integration into the postsecondary environment due to the kinds of interactions they had with students and professors before college, while the former group misses these advantages.12

Expectations of adults and students. Across the country, attending college is increasingly seen as a social expectation and requirement.13Unfortunately, not all students receive this expectation equally. Whether by race/ethnicity or economic status, traditionally underrepresented students tend to be the subject of lower expectations on the part of teachers,14 and teachers are more likely to enforce compliance and obedience among low-income students than among students from better economic backgrounds, where they stress an array of beneficial interactive and academic skills.15 Some studies even suggest that for disadvantaged students, parental aspirations for children’s postsecondary success are lower (though this finding is somewhat ambivalent).10 Additionally, guidance counselors in schools with higher low-income concentrations tend to be more focused on steering students toward the workforce, while counselors in private schools place more emphasis on students developing themselves on the whole.16 Behaviors such as these on the parts of adults, even done unconsciously, can convince low-income students that striving for higher levels of educational attainment is simply not for them. According to Gagnon & Mattingly (2015), even when students from low-income backgrounds have near-identical access to AP courses compared with higher-income peers, they are about three times less likely to enroll in these courses.17 In a study of several high schools attempting to detrack, Yonezawa et al. (2002) found that several factors prevented underrepresented students from moving into higher-track courses, among them the students’ own unwillingness and intimidation by the atmosphere surrounding higher-track classes.18 The same pattern emerges for college application. Higher-achieving low-income students are less likely than their higher-income peers to enroll in four-year colleges, despite their equivalent academic qualification.10 According to a 2013 study, only 8% of high-achieving students from economically challenged backgrounds applied to postsecondary institutions reflective of their capabilities.19

Information about college and support for postsecondary aspirations. Having a willingness to apply and enroll in college is possible and beneficial only if students are adequately informed about the application process, and about the demands that will be made of them upon matriculation. At the most basic level, students from lower-income backgrounds tend to have less access to guidance counselors, leaving them more prone to lack information about what is needed to arrive at and succeed in college.10, 20 Many low-income families are also intimidated by the published tuitions of colleges, not realizing that they could potentially receive substantial financial aid.19 However, there are a number of programs designed to make students and their families more aware of the options available to them. One such initiative, the Expanding College Opportunities project, was able to dramatically improve the extent to which low-income students applied to institutions that matched their abilities at a cost of only $6 per student.19 Early results from another program, the College Ambition Project—operating on a whole-school level to bridge the gaps between college ambitions and entrance by focusing on different aspects of the college matriculation process—suggest that comprehensive but affordable schoolwide intervention can be conducted to improve enrollment trends for disadvantaged students.20, 21 High schools can also significantly increase the chances that students gain access to and attend four-year colleges by establishing systems of support and encouraging students to apply for financial aid.22

School culture/climate. A 2013 report drawing on statewide California data for male students showed that discipline has a strong connection with postsecondary aspirations, which disproportionately affects low-income students. Low-income students who had been suspended or expelled were half as likely to attend a four-year college as similar-income peers who were not disciplined, and less than half as likely as higher-income peers who received such discipline (middle/high-income students who faced harsh disciplinary action were also much less likely to attend a four-year school than similar-income peers who did not face this).23

Methodology

School-level data were obtained through EdSight, a portal constructed by the State of Connecticut to access different kinds of information on students and teachers. Although Connecticut offers a wealth of data through EdSight, this collection is still in development, and data are not always available for all subgroups in all schools. In particular, data for free/reduced lunch-eligible (FRL) students are often suppressed to protect student anonymity.

The class of 2014 is the most recent cohort for which enrollment and persistence data were available. In order to be considered, a school had to have non-zero FRL composition, as well as data available for FRL high-school composition, graduation rates, and postsecondary enrollment/persistence. By the time non-qualifying schools were excluded from the dataset, there were 52 schools remaining; of these, 37 (71%) had FRL graduation rates of 75% or higher:

Figure 2: the postsecondary enrollment rate vs. the first-second year persistence of FRL students from 37 high-graduation high schools across Connecticut.

The two schools selected were:

  • S1: Trumbull High School (Trumbull), a public school in Fairfield County, CT, where the median income is over $108,000. According to EdSight, it is composed of only 8% FRL students, far below the statewide composition of 37%. 96% of instructors at Trumbull possess a master’s degree.
  • S2: Metropolitan Learning Center for Global and International Studies (MLC), a magnet school in Bloomfield, CT. It is a member of the Capitol Education Region Council (CREC), an organization which (among other things) hosts a group of seven specialized service schools and nineteen magnet schools in the Greater Hartford area. MLC is composed of 35% FRL students.

Data and Evidence**

In this section, I probe for information about different aspects of each school that are relevant to the academic and social factors described above. There are three basic kinds of information I seek:

  • What are the academics like at each school, and what are the levels of student attainment?
  • What kind of climate does each school have, and what kind of support does it offer students?
  • How do people perceive the schools?

Academics & Achievement

For classes graduating by or before 2019, the State has established a minimum of 20 credits for graduation, distributed across the fields of English, social studies, science, mathematics, arts or vocational education, and physical education.24 In their documentation, both schools describe offering a variety of courses in fields beyond these, including technology education, business, agriculture, world languages, to name some. Both schools offer students college courses hosted through local colleges (such as University of Connecticut and Housatonic Community College).25 Trumbull hosts centers for aquaculture and agriscience (a combination of agriculture and plant/animal sciences), both of which are well-regarded; Trumbull reports receiving the designation of the best school statewide for plant science (recently, year not given) and animal science (2014). On its website, MLC highlights that it is the only public school in the state authorized to offer IB courses in both the middle and diploma years (grades 6-10 and 11-12, respectively). Both schools offer the chance for students to learn outside of the classroom, through opportunities such as internships and service learning. In Trumbull, service learning may be done for extra academic credit, and community service is required for graduation; in MLC, service learning is required for students in every year (10 hours for grades 6-7, 15 hours for 8-9, 20 hours for 10-12). Additionally, MLC offers students the opportunity to enjoy international learning experiences, such as long-term exchange learning and shorter-term foreign travel. Because of the variety of opportunities it offers students, MLC has received distinctions and recognitions on a number of occasions. Its website reports that in 2009, the U.S. Department of Education deemed it one of the most successful magnet schools in the country.

In short, both schools have been recognized for their opportunities they offer students inside and outside of class. How are students achieving, given such education? I examined this question on the basis of several measures. As the college-enrollment decisions students make are affected both by themselves and their peers, I examined selected indicators for both FRL students exclusively and all students:

Table 1: High School Academic Achievement
Measure of achievement1 Trumbull (All) Trumbull FRL7 MLC (all) MLC FRL Statewide All Statewide FRL
CSD SAT2 ELA 84% * 51% * 65% 39%
Math 60% * 17% * 39% 15%
CMT/CAPT Science3 77% 60% 30% * 56% 30%
Met college readiness benchmark (CRB)4 54% 33% 37% 25%
AP/IB students5 17% * 42% 36%
College/Career Readiness (CCR) course taking6 91% 85% 100% 100%
1 CSD SAT and CMT/CAPT data are only available for the 2015-16 term. I assume that student performance does not fluctuate from year to year to an extent that would render this comparison invalid with data from the 2013-14 term. All other data for 2013-14 term unless indicated.
2 % of students reaching either of the two higher achievement categories on the SAT test (3 and 4 on a 1-4 scale).
3 % of students at or above the two highest performance categories on the science examination (equivalent to 4 or 5 on a 1-5 scale)
4 Based on results of SAT, ACT, AP, and IB exams. For 11th/12th-grade students only.
5 % of seniors who have enrolled in at least two AP/IB courses in high school
6 Analogous to 5. College and Career Readiness courses incorporates AP and IB, as well as Career/Technical Education, workplace experience, and dual enrollment. These data are provided for the 2014-15 term, prior to which such information was not available.
7 In all cases where they appear, * indicates that the data were suppressed, and – indicates that the data were not available.

While Trumbull FRL students perform lower than the general population of their school in science, they outperform the statewide average for all students. Data were suppressed for these students’ performance on the Connecticut Day School SAT, but given the other data in the table, it is a reasonable assumption that Trumbull FRL students performed higher than statewide counterparts but lower than the general population of their school. At MLC, assessment data for FRL students are suppressed, but the whole population performs noticeably lower than their Trumbull counterparts, despite the fact that they are more likely to engage in CCR work. The science proficiency rate of all MLC students is half that of Trumbull’s FRL students.

While test scores and course taking provide some notion of achievement, they do not represent the eventual outcomes that matter most to educators and policymakers. Though there are many outcomes that are important, the data most easily accessible is the information on high school completion and postsecondary status:

Table 2: Secondary and Postsecondary Attainment
Trumbull (all) Trumbull FRL MLC (all) MLC FRL Statewide (all)
Graduation rate 97% 91% (+4) 96% 97% (+10) 87%
Entrance rate 87% 79% (+6) 85% 85% (+12) 73%
Persistence rate 93% 93% (+5) 87% 87% (-1) 88%
GEP rate1 78% 69% (+13) 71% 72% (+16) 56%
1 Product of the rates of graduation, college entrance, and persistence. Parenthetical numbers give the difference between school FRL attainment and corresponding statewide attainment.

All in all, FRL students at both schools have relatively high educational attainment. With the exception of MLC’s persistence rate, FRL students enjoy greater success than the general population across every measure of secondary/postsecondary attainment. The differences in the individual statistics between the two schools mostly cancel out, leaving very similar GEP rates for both school (though MLC has a clear advantage of 3 % points). Of note, while Trumbull’s FRL students tend to attain at lower levels than the general student body across the different measures (the exception being persistence), the opposite is true for FRL students at MLC, who consistently match or outperform the general student body.

School atmosphere and support structures

Through its crisis intervention specialist, Trumbull maintains three scientifically-based programs (two of which are administered to all students, with the third an elective) to help students recognize and combat depression, develop self-esteem and goals, make decisions, learn self-management, and improve attendance. Students and parents are encouraged to keep connected with teachers and class expectations, and many teachers provide websites for their students’ organization. On its website, Trumbull presents many resources to prepare students and parents for college, including different guides, information about mental health, and college fairs as early as sophomore year. As part of its extracurricular offerings, Trumbull hosts organizations designed to help students support themselves and their peers, in particular the peer mediators and the peer leaders. Both programs admit students on the basis of teacher recommendation and an application/interview process. Peer leaders, whose organization was originally started to warn about the dangers of drug and alcohol use, work in collaboration with the Anti-Defamation League of B’nai Brith (ADL) in order to combat bias and bullying, for which they also receive training (14 hours).The purpose of the peer mediation program is to help students resolve conflicts between peers, a task for which admitted students receive extensive training (30 hours).26 Trumbull is explicit that peer mediation is intended to serve as “an alternative to traditional discipline.” In the 2010-11 year, peer mediators handled 66 incidents; one student mediator commented that the program has thoroughly improved the school’s atmosphere.26

At MLC, counselors make themselves available to students both during and beyond the students’ time at the school. I could not find specific support programs or support-related guides (e.g. for mental health and the like) on MLC’s informational webpage. It does, however, provide an external link to the Trude Mero Family Resource Center operated by CREC. Its handbook also mentions adoption of Positive Behavioral Interventions and Supports (PBIS), in which “a continuum of positive behavior support for all students within a school is implemented in areas including the classroom and non-classroom settings.”27 The school sets clear expectations for student behavior and orderly conduct, as evidenced by its strict dress code (e.g., all high school students are required to wear buttoned shirts and khakis, both of which may be selected from only three colors). MLC also maintains a system of “dragon points” (so named for the school’s mascot) to enforce behavioral expectations. At the start of each academic quarter, all students automatically have ten points; students must retain some minimum of points to partake in certain events and opportunities. Certain violations and academic consequences have automatic point deductions affixed, ranging from one-point deductions (e.g. dress code violation) to ten-point deductions (which is only possible by out-of-school suspension).

Both schools speak of productive and welcoming environments, and MLC mentions on a number of occasions its commitment to upholding and demonstrating that all children are capable learners; but how does their promotion match with the objective data? To assess school climate, I gathered information on attendance and discipline:

Table 3: School climate and culture
Trumbull (All) Trumbull FRL MLC (all) MLC FRL Statewide (all)
Absenteeism rate1 1.5% * 8.2% 15% 10.8%
Suspension rate2 3.1% 9.1% 12.5% 20% 7.4%
Mean suspension count3 1.6 1.9 2.5
Confrontational/General-hazard Incidents4 <295 67 N/A
1 Chronically absent students are those who miss at least 10% of the school year for whatever reason.
2 Percentage of students suspended
3 Of students who are suspended, the average number of suspensions they receive
4 Includes “fighting and battery,” “physical and verbal confrontation,” and “personally threatening behavior.” Data would be included for “violent crimes” and “weapons,” but this information was suppressed for MLC, and so was excluded for both schools for the sake of comparability.
5 This number is the count for the entire Trumbull district, including 11 schools in total. School-level data is suppressed for Trumbull in each of the three included categories, but it must of course not surpass the districtwide total.

Several trends emerge. First, both schools have work to do to lower the suspension rate of FRL students, who in both cases receive more disciplinary action than the average student. Second, in both schools the average suspension count per student is well above 1, although in both schools the average suspension count is lower than the statewide value. Third, MLC witnesses a significantly higher incidence of confrontational events than Trumbull, perhaps explaining why suspensions are more prevalent at MLC. No matter the cause of these incidents, MLC certainly has room to improve its school climate.

Perceptions

While having official accounts of student performance and school climate is valuable, this does not describe the subjective perceptions of those involved, information which is of equal importance. The most informative way to gather the perspectives of students, parents, and others involved with the schools would be interviewing and observing the schools in question on different occasions; this option, however, is not available under given circumstances. For now, I draw on responses to polls distributed by Niche®, an organization that has conducted extensive work in producing rankings, report cards, and school profiles for communities across the United States. The school asks reviewers to label their schools by a five-tiered scale, ranging from “terrible” to “excellent.” The results from all responses for each school are given here:

Figure 3. The numbers shown in the center of the charts are the numbers of total responses for each school.

In its reviews, the website offers reviewers the option to categorize their responses by certain tags; the responses for some of these categories are given here:

Figure 4. Numbers in centers represent quantity of responses posted in each category. Note that there are more categories on Niche’s website than the ones provided here.

All in all, both schools have received far more positive than negative reviews. Trumbull tends to receive positive ratings all around, and in the four subcategories examined, only one category (student life) contained any decidedly negative responses. MLC received no negative ratings in two categories, both of which pertain to the academic content of the school. Average reviews are also rather common. Here are some of the comment themes, positive and negative, left by reviewers:

  Table 4: Niche Reviews of Schools

Trumbull MLC
Positive
  • Many teachers are supportive
  • Many report a friendly, welcoming, supportive environment in general
  • High school spirit
  • Many teachers are supportive
  • Relatively new facility, safe school environment
  • Students have opportunity to travel the world, interact with kids from various other cultures
  • Block schedule similar to schedule of college classes
  • Strong academics
Negative
  • Teachers say that students should ask for help but sometimes become frustrated with students or do not offer assistance
  • Instruction does not always have depth to it
  • Social environment may be too defined by cliques
  • Undesirable variability in teacher quality
  • Undesirable variability in teacher quality and open-mindedness
  • Teachers do not always respect students; “[they] treat some of us as 5 year old [sic].”
  • Extracurricular activities could use more funding
  • Recurrent comments about lack of support for extracurricular programs, especially sports

As expected, neither school is perfect: in both, commenters report variations in teacher and class quality. The implications of these features will be discussed in the following section.

Note that these survey results, due to the limited numbers of responses and the method of collection, should be interpreted with caution. This is by no means scientific, and these responses may not be representative of the views of all parents and students involved with these schools. There is no way to predict how these results might be biased because of insufficient sampling and due to other factors that affect who had access to Niche’s surveys. These surveys do, however, give some insight into the workings of each school and the experiences that some people have had therein.

Discussion

Given the information I have presented, the questions I seek to answer are:

  • What elements of each school enable FRL students to succeed at high rates compared to the state?
  • What might account for differences between the schools, and where does each have room to improve?

In both schools, there is evidence of high academic attainment during and after high school. Even though many students fall short of proficiency on statewide measures and CRBs, these might not be the best indicators of college preparation. That in either school no more than a third of 11th and 12th grade low-income students surpass a CRB, yet no less than 85% of students persist from the first to second year of college, suggests that meeting a CRB is far from the only important factor in postsecondary success. More important seems to be the exposure students have to high-level coursework and real-world experiences in the forms of internships and workplace participation, which is very high for both schools.

Trumbull appears to have an extensive array of supports and encouragements built in for students. Its website provides many informative resources from which parents and students may benefit, and it creates a culture of success by promoting college attendance as early as sophomore year. High percentages of Trumbull students go on to four-year colleges (in 2013-14, about three quarters of recent graduates), which likely creates an expectation of college for the majority of students in the school. Trumbull has made very clear efforts to maintain a supportive and productive school climate through its curriculum-integrated self-development education and peer-led support programs, the effects of which are evidenced by low schoolwide rates of absenteeism and suspension. MLC creates a strong culture of achievement codified in high expectations and a clear system of consequences for different behaviors. It establishes a commitment to getting children to succeed during and after high school, even if that means providing counseling for students after they graduate.

In both schools, students also have the opportunity to capitalize on resources beyond what they gain purely from academics. Trumbull’s extensive array of extracurricular organizations not only provide students the chance to pursue varied interests, but also access to valuable social interaction and, as observed by one Niche reviewer, skills that become very useful in future extracurricular activities, internships, and jobs. Although it is a public school, Trumbull epitomizes Anthony Abraham Jack’s description of the “privileged poor:” it is a high school in which low-income students are immersed in a social environment that allows them to succeed at very high rates (on par with the general student body) when they enroll in college. MLC has the advantage of a highly integrated student body where students from all backgrounds can engage in enriching experiences (such as foreign travel and interaction with international peers) that most students in standard schools do not have. Its requirements of service learning as early as sixth grade and independent research by the time of graduation likely foster a sense of academic independence that encourages students to pursue postsecondary success.

Although both schools are highly successful in comparisons other Connecticut high schools, there is still room for improvement when compared to each other and themselves. Although Trumbull’s FRL students demonstrate that they are just as capable of succeeding as anybody in college, they are noticeably less likely to enroll in college. Before that, they are also less likely to graduate from high school than other Trumbull students. Why might this be? Although Trumbull provides many resources online and in school for students to utilize for support and information, it is possible that not all students have equal access to these resources. FRL students engage in college-level work at high rates, but not on par with other students. Although their immersion in an affluent school may provide them with valuable social capital (contributing to high persistence rates), it is conceivable that their low representation in the school’s population serves as an isolating factor which discourages some (though clearly not most) students from applying to college. Additionally, Trumbull students have lower rates of exposure to CCR coursework than students at MLC, and there is a gap between the higher-level coursework loads of Trumbull’s general student body and FRL students. Giving more students the opportunity to engage in college-level work could encourage postsecondary enrollment, perhaps explaining why MLC’s FRL students enroll at a rate that rivals that of Trumbull’s full student body.

MLC is different from Trumbull in two ways: gaps between FRL students and the general student body have closed, and students are more likely to graduate and enroll in college, but less likely to persist. One might point to the high rates of suspension and strict behavioral policies established by MLC; although such an environment works for most students (as 87% persist from first to second year), it is possible that those students who do not persist attend colleges which do not provide as much structure. Although MLC strives to produce students who are academically independent, it is possible that students are not learning to be sufficiently independent and self-promoting in other domains. In any case, it is somewhat startling to see that one out of every five FRL students is suspended at MLC, a practice which might not be discouraged by its host organization. According to EdSight, while suspension rates have monotonically declined statewide since the 2011-12 term, they have (overall) increased at CREC schools. Being that students who are suspended automatically lose either five or ten dragon points—thereby excluding them from some of the special opportunities and incentive activities the school offers—that the average suspension count per suspended student is approximately 2, and that low-income students are disproportionately affected by suspension, it is quite conceivable that MLC’s disciplinary policy is disproportionately keeping low-income students from the activities meant to enrich their education.

Conclusion & Recommendations

Before discussing conclusions and policy recommendations, I discuss the limitations of this review. Although Trumbull posts the percentages of students who go on to 4-year and 2-year colleges in its programs, it does not say what the distribution of attendance is among student subgroups. I was unable to find information regarding where MLC students go to college. Also missing from the data is the last stage of postsecondary attainment, which is graduation and degree attainment. It would be very useful to examine how student performance varied by the type of institution attended for different subgroups, and what differences emerged (if any) between Trumbull and MLC. Moreover, this report focuses only on certain features of each school that might account for the observed levels of postsecondary success; there are important variables which affect secondary and postsecondary success that were beyond the scope of this paper. Additionally, this report was not derived from extensive observation of each school and conversations with the various constituents, but from data which was externally and electronically accessible at the time of writing. It identifies correlations, which are not guaranteed to have causal meaning. Were this study to be extended, it would be most improved by such engagement with the local communities involved and investigation of further outcomes.

Given these limitations, this report makes some novel contributions. There is a wide literature on what kinds of high school properties contribute to or detract from student success at the secondary and postsecondary levels; this study begins the assessment of how these features compare between two public schools with highly successful low-income students, identification of how each school’s goals are realized and hampered by their policies, and how the constituents involved in each school perceive the school’s actions. Based on the available evidence, I find these elements to be the most likely contributors to the success of low-income students, and I recommend that policymakers and educators seeking to increase the postsecondary success of economically disadvantaged students implement these in other places:

Expose all students to high-level work and real-world experiences. The more students engage in college-level work and work experiences in high school, the more prepared they will be going forward. This enhanced preparation will in turn convince more students that they are ready for the challenges of higher academia.

Improve school climate. Research has tied college enrollment to secondary discipline, and in this case study, it appears that school climate and student behavior (as gauged by attendance and suspension) matters more in the long run for persistence in college.

Increase low-income participation in extracurricular activities, whether in the form of organizations or supplemental learning. As seen in these two schools, offering students enrichment beyond the time spent in class, whether in the form of external organizations, community service, or supplemental learning, plays an important role in personal development which is not always fulfilled by work assigned in class.

Encourage collaboration between colleges and high schools to determine appropriate levels of structure, independence, and support. Schools must find a proper balance between maintaining structure and cultivating independence, academic and social, in order to maximize the chance for student success. Both schools studied in this report attempt to do this in different ways, and arguably both do a relatively good job (though there is always room for improvement), which contributes to the success of their students.

Hold students to high expectations. Trumbull’s FRL students are immersed in a school where the overwhelming majority of graduates go to four-year colleges; MLC students are held to high behavioral expectations in school and attempt to mirror the experiences that students will have beyond high school in order to create a culture of high attainment.

Encourage peer interaction across diverse student groups. One advantage that MLC retains is its high racial and socioeconomic integration, which is compounded by interactions with international professors and students. This appears to be an effective way of reducing (and in this case eliminating) gaps between subgroups and raising collective aspirations.

References

** All tabulated, quantitative data presented in the Data and Evidence section is obtained from EdSight, either from table generators or internal documents, unless otherwise noted. All information regarding the schools’ academic offerings, support programs, and other descriptions may be found through subdirectories of their websites, namely https://www.trumbullps.org/ths/ and http://www.crecschools.org/our-schools/metropolitan-learning-center/. Information about the CREC district may be found via http://www.crecschools.org/ and subpages. Information about these schools/districts obtained from external sources are cited separately. Relevant documents for Trumbull include the handbook (http://www.trumbullps.org/ths/images/docs/2013-14Docs/POS%2013-14.pdf), the school profile (https://drive.google.com/file/d/0B8AytrfwDhFCTDU2VkZqWjBVcE0/view), and the FAQ (http://www.trumbullps.org/ths/images/docs/2015-16Docs/FAQ1516.pdf); for MLC, the handbook (http://crecmagnetschools.com/files/file/News/Documents_MLC/ParentStud.Handbook20112012Final72111.doc.pdf).

1 Welner, K. G., & Weitzman, D. Q. (2005). The soft bigotry of low expenditures. Equity & Excellence in Education, 38(3), 242-248.

2 White House (undated). Higher Education. The White House. Located at https://obamawhitehouse.archives.gov/issues/education/higher-education.

3 Cahalan, M., Perna, L., & Yamashita, M. (2016). Indicators of higher education equity in the United States: 2016 historical trend report. Pell Institute for the Study of Opportunity in Higher Education.

4 U.S. Department of Education, National Center for Education Statistics. (2009).  Table 302.30: Percentage of recent high school completers enrolled in 2-year and 4-year colleges, by income level: 1975 through 2015. In U.S. Department of Education, National Center for Education Statistics (Ed.), Digest of Education Statistics (2016 ed.). Retrieved from https://nces.ed.gov/programs/digest/d16/tables/dt16_302.30.asp?current=yes.

5 College Board (2016). Trends in Student Aid. The College Board.

6 Ikoma, S., & Broer, M. (2015). How Can We Help Students Match College Aspirations to College Enrollment?. InformED Blog. Washington: American Institutes for Research, Education Policy Center. Accessible via http://educationpolicy.air.org/blog/how-can-we-help-students-match-college-aspirations-college-enrollment.

7 Youth, H. A. Postsecondary Access, Persistence, and Completion of Houston-Area Youth.

8 Fletcher, J. M. (2010). Peer Influences on College Choices: New Evidence from Texas.

9 Elia, M. S. (2015). Parenting Practices of Lower Socioeconomic Status Parents of High Achieving Students.

10 Kuh, G. D., Kinzie, J., Buckley, J. A., Bridges, B. K., & Hayek, J. C. (2006). What Matters to Student Success: A Review of the Literature.

11 Engle, J., & Tinto, V. (2008). Moving Beyond Access: College Success for Low-Income, First-Generation Students. Pell Institute for the Study of Opportunity in Higher Education.

12 Jack, A. A. (2015). What the Privileged Poor Can Teach Us. New York Times: Sunday Review Accessible via https://www.nytimes.com/2015/09/13/opinion/sunday/what-the-privileged-poor-can-teach-us.html?_r=2.

13 Arum, R., & Roksa, J. (2011). Academically adrift: Limited learning on college campuses. University of Chicago Press.

14 Papageorge, Nicholas W. and Gershenson, Seth and Kang, Kyungmin, Teacher Expectations Matter. IZA Discussion Paper No. 10165. Available at SSRN: https://ssrn.com/abstract=2834215

15 Golann, J. W. (2015). The paradox of success at a no-excuses school. Sociology of Education, 88(2), 103-119.

16 Clinedinst, M. E., Koranteng, A., & Nicola, T. (2015). State of college admission. Washington, DC: National Association for College Admission Counseling. Accessible via https://www.nacacnet.org/news–publications/publications/state-of-college-admission/.

17 Theokas, C., & Saaris, R. (2013). Finding America’s missing AP and IB students. Education Trust.

18 Yonezawa, S., Wells, A. S., & Serna, I. (2002). Choosing tracks:“Freedom of choice” in detracking schools. American Educational Research Journal, 39(1), 37-67.

19 White House (2014). Increasing college opportunity for low-income students: Promising models and a call to action. Report, Executive Office of the President.

20 Schneider, B., Khawand, C., & Judy, J. (2012). The college ambition program: Improving opportunities for high school students transitioning to college. In spring conference of the Society for Research on Educational EffectivenessAccessible via https://www.sree.org/conferences/2012s/program/downloads/abstracts/548.pdf

21 Schneider, B., Broda, M., Judy, J., & Burkander, K. (2013). Pathways to college and STEM careers: Enhancing the high school experience. New directions for youth development, 2013(140), 9-29. Accessible via https://www.ncbi.nlm.nih.gov/pmc/articles/PMC4135439/

22 Roderick, M., Coca, V., & Nagaoka, J. (2011). Potholes on the road to college: High school effects in shaping urban students’ participation in college application, four-year college enrollment, and college match. Sociology of Education, 84(3), 178-211. Accessible via https://consortium.uchicago.edu/sites/default/files/publications/SOE_Potholes.pdf

23 Terriquez, V., Chlala, R., & Sacha, J. The Impact of Punitive High School Discipline Policies on the Postsecondary Trajectories of Young Men. Pathways to Postsecondary Success. Accessible via  https://pathways.gseis.ucla.edu/publications/Discipline_Report.pdf.

24 Connecticut Association of Schools (undated). Connecticut General Statutes 10‐221a ‐ High school graduation requirements. Student support and remedial services. Diplomas for veterans of World War II and the Korean hostilities. Collection of certain student information. Accessible via https://www.casciac.org/pdfs/CT_Graduation_Requirements.pdf

25 Capitol Education Region Council (undated). Magnet School Annual Report 2013-2014 CREC Metropolitan Learning Center for Global and International Studies. Connecticut State Department of Education. Accessible via http://www.sde.ct.gov/sde/lib/sde/pdf/equity/magnet/MLC.pdf.

26 Fuchs, R. (2011). THS Students Combat Bullying with Mediation. Trumbull Patch: Schools. Accessible via https://patch.com/connecticut/trumbull/trumbull-high-schools-mediators.

27 OSEP Technical Assistance Center on Positive Behavioral Interventions and Supports (2017). Positive Behavioral Interventions & Supports. Accessible via https://www.pbis.org/school.

“Shopping for Schools” and the Perpetuation of Racial Segregation in Schools

By: Julie Zhu

Executive Summary

Segregation in the American education system continues to pose issues for our country, but in particular for students who are currently studying in American schools. Although housing policy and transportation policy has been cited and studied as contributors to the segregation, education policy and the real-estate market has had less of a spotlight. This essay attempts to explain how the individual choices which led to suburbanization, “white-flight” and “shopping for schools” has contributed to the persisting racial segregation of the American education system. I evaluate the failure of busing as a method of desegregation and propose the method of building magnet schools in urban areas as the better solution.

Introduction

Segregation in schools and society has been a problem in the United States since the founding of our country and continuing to today, despite the civil rights movement and Brown v. Board. In current day, the American education system continues to experiences racial and class segregation. However, rather than laws or policies that explicitly dictate all-white and all-black schools, there is a “color-blind rhetoric of individual merit,” that does not consider the unequal and unjust system that inherently advantages some of these very individuals while disadvantages others (Dougherty, 2012, p. 207). An example of this rhetoric was spoken by, William Bradford Reynolds, President Reagan’s Assistant Attorney General for civil rights, who said, “Each one of us is promised the right to be judged on the basis of individual talent and worth, not the color of one’s skin.” (Morrison, 1993, p. 315)A consequence of this color-blind and merit mentality is the mentality that, given the resources, a family should be able to “buy access into” better school districts for their own children (Dougherty, 2012, p. 220). In other words, it leads to the phenomenon of “shopping for schools” which perpetuates racial segregation in public schools (Dougherty, 2012, p. 207).

The issue of segregation continues to be problematic in metropolitan areas in particular because the phenomenon of suburbanization and pro-suburban ideology has created great inequality in terms of access to quality education. I argue in this paper that, although housing and transportation policy has contributed to this segregation, education policy and real-estate in this era of suburbanization has also had an important influence in the perpetuation of segregation of schools in the United States. Furthermore, I discuss one past solution, busing across district lines, that I argue has failed to rectify segregation in schools. Last, I propose an initial solution to this problem: building magnet schools in urban areas and replacing the members metropolitan land-use committees with people who do not have a conflict of interest.

Persisting Problem: Continued Segregation in Schools

Segregation in Schools Due to Housing and Transportation Policy – Favoring Suburban Homes

Most scholars attribute the segregation that still exists in the American education system to a be a product of federal housing and transportation policy. The advent of federally subsidized home mortgages and highways, in particular, allowed white middle-class families to move away from urban areas (Dougherty, 2012, p. 206). Dougherty, and other scholars, argues this was motivated by a desire for “social mobility and racial avoidance.” (2012, p. 206) However, what many of these analyses miss is the role of education policy and marketing in also perpetuating segregation, in particular the growing concept of buying into a school district and “shopping for schools” that became popular in the late 1950s to early 1960s (Dougherty, 2012, p. 205).

Segregation in Schools due to Education Policy –  Favoring Suburban Locations

Some scholars have recently begun looking at education policies and guidelines that also contributed to segregation in American schools. Ansley Erickson, a professor at Columbia University –Teacher’s College, studied the spatial organization of schools in Nashville, TN, and her research reveals that “city planners and school construction practices [often]…favored segregated white suburban spaces” for the construction of new schools (Erickson, 2012, p. 250). For example, the Metropolitan Planning Commission and the Metropolitan Public Schools “surveyed the school system and projected future need” in 1963 when the city of Nashville and the surrounding area consolidated governments to create one metropolitan municipality. Their report, Schools for 1980, advised that “areas with objectionable features [such] as dust, noise, odors, smoke, congested traffic, busy highways and railroads should be avoided as site locations,” as “these nuisances destroy the proper environment for teaching and learning.” (Erickson, 2012, p. 253) In a another report made in 1970 about a school construction policy, the authors noted in particular that “locating schools in areas zoned for commercial or apartment use should be avoided whenever possible.” (Erickson, 2012, p. 254) This illustrates how the planning commission and the public schools were implicitly, and sometimes rather explicitly, favoring suburban areas over urban areas for school locations.

Another example of the pro-suburban education policy in Nashville was the minimize campus size requirements set by the Nashville Metropolitan Planning Committee and Board of Education in 1964 in Schools for 1980, which required “at least ten acres for an average elementary school and more than thirty for an average high school, with an acre covering roughly the area of a football field.” (Erickson, 2012, p. 254) These new size requirements necessitated new school construction occur in suburban areas because this kind of space was not feasible or affordable in the city of Nashville.

This pro-suburban ideology led many metropolitan governments to allocate more funds to suburban schools, often at the cost of urban schools who went without necessary renovations or were even closed. For example, Erickson shows us that in the metropolitan area of Nashville-Davidson County, between 1971 and 1980, over ten urban schools were shut down, while in the decade before, over ten schools were constructed in the suburbs surrounding the city.

Figure 1A + 1B[1] (Erickson, 2012, p. 252)

Segregation due to Shopping for Schools Phenomenon

“Shopping for schools,” as referred to here, is the phenomenon in which families with enough financial and social resources tend to move to areas with better local school districts for the sake of the children’s education. Having enough financial resources means that the family is able to afford a more expensive house and lifestyle in, usually, a suburban area. Social resources referred to social status, which in this case is largely determined by an intersection of class and race. Dougherty explains that there were cases in the 1950s when real-estate agents would refuse to sell a house to a middle-class black family because they were convinced that a black family moving in would deflate housing prices (Dougherty, 2012, p. 215). Lastly, better local school districts generally means having high test-scores and high school ratings according to pro-suburban standards often set by outsider consultants (Erickson, 2012, p. 259). The way “better” has been conceived of already advantages suburban schools and disadvantages urban ones. Because suburban areas are more expensive to live in, a greater proportion of middle-class and upper-class families attend suburban schools which tends to raise test scores. Low-income students in urban areas tend to test relatively poorly compared to their more affluent peers. Furthermore, the standards set to evaluate these schools are skewed to rate suburban schools more highly. For example, Nashville commissioned a report in 1971 called “Building and School Improvement Study” (BASIS) which put forth standards that evaluated school based on the “age” and “condition” of the surrounding neighborhood. This means a modern school set in an poor neighborhood would be marked down, suggesting “there could be no excellent school in a poor neighborhood.”(Erickson, 2012, p. 259) Therefore, “shopping for schools” phenomenon is evidence of a strong pro-suburban ideology that not only permeated government action and policies, but also individual families and individual people who wanted to move to the suburbs for better schools.

So where did this ideology come from? It is not necessarily supported by rigorous social science research that proves living and learning in suburban-like places is in any way better than living and learning in urban-like areas. Rather, Erickson, Dougherty and other scholars argue that the pro-suburban ideology in this phenomenon of choosing schools was largely promulgated by the interactions between real-estate agents and individual, predominantly-white, families, during the era of post-WWII suburbanization (Benjamin, 2012; Boustan, 2007; Dougherty, 2012; Erickson, 2012). During the late 1960s and 1970s, real estate agents would market houses in a certain area as included in a certain “brand name” school district, which would give it much more value (Dougherty, 2012, p. 210). The chart below illustrates the uptick in residential advertisements that mentioned a specific school name during the era of post-WWII suburbanization during the 1960s and 1970s.

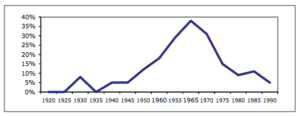
Figure 2. Percentage of West Hartford home advertisements mentioning a specific school, 1920-1990. (Dougherty, 2012, p. 213).

And this added-value in homes within certain school districts was afforded by the families clamoring to send their children to the “best” schools.

Furthermore, Erickson notes that these pro-suburban guidelines for school location became more popular when the development of suburbs was beginning to flourish. These guidelines were promulgated by commissions who were staffed by people who all had a stake in the real estate industry (Erickson, 2012, p. 251). Therefore, the building of schools in suburbs served the “local real-estate interests” which really meant it served the interests of those on the planning commissions. Therefore, the marketing of these schools in the private housing industry became a very important component of attracting white upper-middle-class families to the suburbs, exacerbating and continuing the issue of segregation in the public school system.

The reason why marketing schools in this way is such a successful method of attracting white, middle-class families is because of the “growing importance of educational attainment” in terms of the labor market and for upward social mobility (Dougherty, 2012, p. 220; Scherger & Savage, 2010). There is a growing body of research that shows social mobility processes, “whether across generations or in the course of one work-life, are strongly determined by educational attainment.” (Allmendinger, 1989, p. 231) Allmendinger, also reveals in her research that “individual choices about schooling are significantly shaped and constrained by the opportunities the environment offers.” (Allmendinger, 1989, p. 231)

In addition, in the late 1960s real estate agents have continued to played upon the racial avoidance of white families through block-busting tactics to make more money for themselves. Block-busting in this case is the practice of purposefully selling a house to a Black family in an all-white community and then pressure the white families to sell their properties at a price below market value “in order to ‘get out’ before more blacks moved in and their home values dropped even further.”  (Dougherty, 2012, p. 216)These real-estate marketing tactics facilitated white flight and continuously segregated schools and unequal access to quality schools.

Failed Solution: Busing

One solution that many metropolitan areas resorted to in the face of continued segregation was assigning and busing students to schools outside their district in order to gain greater racial diversity in each school (Felice, 1975; Pride & Woodward, 1995). One such location was the metropolitan area of Nashville, which I have discussed previously. In 1971, Nashville’s U.S. District Court’s Judge Morton, mandated that busing would be required (Erickson, 2012, p. 259). The officials of the Department of Health, Education and Welfare (HEW) strove for “each school to have approximately 15 to 35 percent black students,” which was generally achieved through clustering a few schools together and reassigning by grade-level. However, in most cases, HEW officials had to group “two or more noncontiguous areas” together and then reassign students in order to achieve the 15-35% black student proportion (Erickson, 2012, p. 260). After the system was implemented in 1971, there were two main unintended consequences that became its fatal flaw.

Fatal Flaws

One fatal flaw in the system was that the burden of busing fell disproportionately on the “shoulders of black urban students.” (Erickson, 2012, p. 260) The burden was more than just “mere inconveniences.” (Erickson, 2012, p. 261) Parents of students who were bussed out of the local district often had difficulties “communicating with and traveling to school, especially if they did not own a car.” These students also often could not participate in the extracurricular activities at their school, and some also received “harsh treatment” from teachers and other students, “lower expectations” in academics, and “alienation.” (Erickson, 2012, p. 261) Then even persevering through all of these burdens, the achievement gap persisted and segregation in schools continued to be an issue.

The second fatal flaw was that busing led real-estate agents to re-segment the area to separate the residences that fell inside the busing zones and outside the busing zones. Thus, after the busing mandate in Nashville, real estate agents began marketing residences in a way similar to their marketing of residents at the beginning of the suburbanization era, but this time segmenting the areas affected by bussing and racial quotas and not affected by bussing. One such advertisement boasted, “no bussing here.” (Erickson, 2012, p. 261)

In addition, Erickson noted that the farther away the the school districts, the less affected the property values were by presence of black students in the schools. Erickson argues it is the long distance from the city that “made the presence of black students in its schools less likely to imply racial transition in property as well.” (Erickson, 2012, p. 262)  The implication here was that a transition in the racial demographics of the residential area would devalue the community and property values because at the time black families were seen as having a lower social status. In West Hartford, “Superintendent Thorne blamed real estate agents for creating…“social class consciousness” among…residents.”(Dougherty, 2012, p. 212) This second fatal flaw became fatal because bussing never addressed this underlying issue of social class consciousness.

Proposed Solution

I argue that the best next steps are three-fold: first, to build and fund magnet schools in urban centers; second to replace pro-suburban standards for evaluating schools with standards for quality schools based on scientific research; and third, replacing members of the metropolitan planning committees and commissions with qualified professionals without a conflict of interest in real-estate.

Building and funding magnet schools in cities would create a pull-factor for white, middle class families to move to the city. Since around 1975, magnet schools have been used as “a method of desegregation.” (Goldring & Smrekar, 2002, p. 13) And although magnet schools have their issues, such as a lack of integration within the school, they have been a powerful and effective tool in moving towards desegregation (Rossell, 1985; West, 1994). However, scholars are far from fully understanding how magnet schools facilitate desegregation, and further research is necessary.

Replacing the politicized pro-suburban standards for evaluating schools with standards based on reliable research will also help give a more objective evaluation of the quality of schools, rather than skewing scores in favor of suburban schools for no reason besides benefitting those with stakes in the real-estate industry. It is important to note that further research on what characteristics facilitate effective learning is also needed.

Last, replacing members of the metropolitan planning committees and commissions with members without a conflict of interest in real-estate allows for the above two reforms to be politically viable.

Conclusion

At the core of the issue, there are still the individual agents and families who choose to move. However, it is important to identify the larger forces which encourage and perpetuate these individual choices which create the continued system of segregation in schools around the country. I argue an important part of this dynamic is how education policy and the real-estate marketing greatly influences the choices of these individuals. Furthermore, busing as a solution to promote desegregation has failed because of the pro-suburban ideology that permeates education policy, real-estate marketing, and also the choices of white, middle-class families. Therefore, I support using magnet schools in urban areas to rectify segregation in these metropolitan areas.

Acknowledgements

Thank you to my dear friends and classmates, Alison Levosky, Stephanie Addenbrook, and Brian Pok, for providing emotional and intellectual support throughout this project and this semester. Thank you to Alison Levoksy and Jaclyn Price for their insightful and helpful edits. Thank you to Professor Mira Debs for educating us about education!

Bibliography

Allmendinger, J. (1989). Educational Systems and Labor Market Outcomes. European Sociological Review, 5(3), 231–250.

Benjamin, K. (2012). Suburbanizing Jim Crow: The impact of school policy on residential segregation in Raleigh. Journal of Urban History, 38(2), 225–246.

Boustan, L. P. (2007). Was postwar suburbanization“ White Flight”? Evidence from the black migration. National Bureau of Economic Research. Retrieved from http://www.nber.org/papers/w13543

Dougherty, J. (2008). Bridging the gap between urban, suburban, and educational history. In Rethinking the history of American education (pp. 245–259). Springer. Retrieved from http://link.springer.com/chapter/10.1057/9780230610460_10

Dougherty, J. (2012). Shopping for schools: How public education and private housing shaped suburban Connecticut. Journal of Urban History, 38(2), 205–224.

Dougherty, J., Harrelson, J., Maloney, L., Murphy, D., Smith, R., Snow, M., & Zannoni, D. (2009). School Choice in Suburbia:Test Scores, Race, and Housing Markets. American Journal of Education, 115(4), 523–548. https://doi.org/10.1086/599780

Erickson, A. T. (2012). Building Inequality: The Spatial Organization of Schooling in Nashville, Tennessee, after Brown. Journal of Urban History, 38(2), 247–270. https://doi.org/10.1177/0096144211427115

Felice, L. G. (1975). Mandatory Busing and Minority Student Achievement: New Evidence and Negative Results. Retrieved from http://eric.ed.gov/?id=ED114444

Gallagher, C. A. (2003). Color-Blind Privilege: The Social and Political Functions of Erasing the Color Line in Post Race America. Race, Gender & Class, 10(4), 22–37.

Glass, M. R. (2016). From Sword to Shield to Myth Facing the Facts of De Facto School Segregation. Journal of Urban History, 96144216675473.

Goldring, E., & Smrekar, C. (2002). Magnet Schools: Reform and Race in Urban Education. The Clearing House, 76(1), 13–15.

Lassiter, M. D. (2012). Schools and housing in metropolitan history: an introduction. Journal of Urban History, 38(2), 195–204.

Morrison, J. E. (1993). Colorblindness, Individuality, and Merit: An Analysis of the Rhetoric against Affirmative Action. Iowa Law Review, 79, 313–366.

Pride, R. A., & Woodward, J. D. (1995). The Burden of Busing: The Politics of Desegregation in Nashville, Tennessee. Univ. of Tennessee Press.

Rossell, C. H. (1985). What is Attractive About Magnet Schools. Urban Education, 20(1), 7–22.

Scherger, S., & Savage, M. (2010). Cultural Transmission, Educational Attainment and Social Mobility. The Sociological Review, 58(3), 406–428. https://doi.org/10.1111/j.1467-954X.2010.01927.x

Siegel, R. B. (2000). Discrimination in the Eyes of the Law: How “Color Blindness” Discourse Disrupts and Rationalizes Social Stratification. California Law Review, 88(1), 77–118. https://doi.org/10.2307/3481275

West, K. C. (1994). A Desegregation Tool That Backfired: Magnet Schools and Classroom Segregation. The Yale Law Journal, 103(8), 2567–2592. https://doi.org/10.2307/797056

[1] Sources: MPC, Schools for 1980; School Directory, MNPS, 1979-1980; City of Nashville Public Schools Directory,1960-1961;“Pupil Enrollment,” 1969,Kelley,Box 11,File 4;“FifteenYearAnalysis of Enrollment Trends, Metro Nashville Public Schools,” 1984, Kelley, Box 21, File 1984; and John Egerton,“Analysis of Data From Interrogatories Submitted to Metropolitan School System,” 1970, Kelley, Box 11, File 4, (1 of 2). 1970 population figures are from the 1970 Decennial Census, available from Minnesota Population Center. National Historical Geographic Information System: Pre-release Version 0.1. Minneapolis, MN: University of Minnesota 2004, at http://www.nhgis.org. I am indebted to the staff of Columbia University’s Electronic Data Service (now Digital Social Science Center) for extensive assistance with GIS.

Don’t Say Gay: Why States Are Erasing LGBTQ Students, and How They Have the Power to Change It

Sara Harris

EDST 245: Public Schools and Public Policy

Professor Mira Debs

May 3rd, 2017

Don’t Say Gay:

Why States Are Erasing LGBTQ Students, and How They Have the Power to Change It

Executive Summary

Over the past 60 years in particular, the American public education system has seen significant progress toward creating an inclusive, equitable environment for all students; there has been equal challenges met along the way, however. Inclusive educations has made numerous strives, yet today, some students still remain unsafe and unrepresented. More than half of LGBT-identifying students report feeling unsafe at school, the majority reporting having experienced direct verbal harassment (The 2015 National School Climate Survey). Not only are they facing this bullying, harassment, and discrimination on a personal level, but many still face this treatment on an institutional level.

While some states have active exclusionary laws (known as “no promo homo”), others protect students from harassment or discrimination, and California stands alone in requiring LGBTQ inclusive curriculum. Previous culture and history wars have left the power of forming and enforcing standards to the discretion of the states, in hopes to better cater to more localized needs, but these laws have been upheld at the detriment of LGBTQ students. Maintaining these laws creates a culture of silence in schools which perpetuate a dangerous environment for these students, and leave educators fearing legal backlash upon mention of the topic. This report will provide historical context for the social and cultural barriers to revising curriculum standards, and review the legality of existing “no promo homo” laws. It will also make the case that not only should states remove discriminatory “no promo homo” laws, but adopt standards mandating inclusive curriculum to ensure a quality education.

Introduction: What is No Promo Homo?

LGBTQ students in American public schools are not afforded any level of guaranteed safety or representation in the classroom. The responsibility to champion inclusive curriculum falls on the state level; today, California remains the only state to have passed such requirements, while seven states– Alabama, Arizona, Louisiana, Mississippi, Oklahoma, Texas, and South Carolina– have policies known as “no promo homo” laws that effectively silence teachers on the topics of LGBTQ issues, history, and health (The Trevor Project, 2017). These laws range in exact language and context, but all have the same effect: erasing these students’ presence and any attempt by educators to acknowledge or support them.

From Gay, Lesbian, & Straight Education Network (GLSEN, n.d.)

Within the modern education reform debate, attempts to create inclusive, diverse curriculum  have taken center stage many times; this has influenced numerous initiatives and decisions even when not the primary focus. In these seven states, educators cannot even entertain the idea of LGBTQ-inclusive curriculum, let alone speak about the topic in the classroom. Alabama currently mandates that “an emphasis, in a factual manner and from a public health perspective, that homosexuality is not a lifestyle acceptable to the general public and that homosexual conduct is a criminal offense under the laws of the state” (Alabama Code Title 16). This references the state’s unenforceable criminalization of homosexuality, a law that was federally overturned in Lawrence v. Texas in 2003. In Arizona, districts are forbidden to include curriculum which “1. Promotes a homosexual life-style or 2. Portrays homosexuality as a positive alternative life-style.” (Arizona Revised Statutes Title 15. Education § 15-716)

These laws perpetuate an image of criminality and shame surrounding students’ identity, and enforce discussion of the topic to be considered taboo. States hold the power to regulate curriculum guidelines and standards, using national standards as a resource to inform and craft the curriculum. The control is given to states in order to allow curriculum formation to happen at the local level to better fit the needs of individual communities (Nash, Crabtree, & Dunn 2000; Zimmerman, 2005). These curricular guidelines come at the cost of students’ wellbeing. States have no legal need to perpetuate a standard of sexual conduct (Lugg, 2003). The idealization of heteronormative relationships is not grounded in any constitutional or other official framework, but rather a reflection of local culture.

All states should be required to remove all language which promotes or mandates discrimination based on sexual orientation and gender identity in the classroom. Repealing all “no promo homo” laws is the only way towards ensuring safety, inclusion, and quality education for LGBTQ students. This need be accomplished either at the state level, which was accomplished in Utah in 2017, if not enforced by the US Department of Education at a national level. Furthermore, states must move towards adopting LGBTQ inclusive curriculums, as the benefits of inclusive curriculum affect all students.

Background: The History of Modern History Curriculum

In the 1990’s, a social and political battle was ignited by a the development of a new system of national history standards. The “Culture Wars”, a resulting debate over the formation of these standards, were fueled by partisan motives and political ties (Nash et. al., 2000). This debate, however, was not the first of it’s kind in American history. After the Civil War, textbooks in Northern and Southern states reported vastly different accounts of the war and antebellum life. The 1920’s saw a rising critique of history textbooks’ accounts of slavery. In the early 1940’s conservative parent groups, led a movement against allegedly “un American” textbooks, primarily written by Harold Rugg. The Rugg books were criticised for propagating “treasonous”, anti-american ideas; within five years the initiative, spearheaded largely by the American Legion, was successful in encouraging districts to phase out the Ruggs book. The 1950s and 60s saw an influx of more diverse Americans graduated with history degrees. This increase in scholarship coincided with the civil rights movement in the 1960’s, and textbooks started to reflect a shift toward a more accurate, honest portrayal of slavery (Nash et. al., 2000; Zimmerman, 2005).

The 1990’s Culture Wars is the most recent iteration of the same political struggles surrounding curriculum. Fueled by an era of political and social tension, much of the debate surrounding the National History Standards followed partisan lines. The narrative and outcome was little different to it’s predecessors; the conflict was, at its core, between those advocating for a “traditional”, celebratory history of American and “American” values, and those advocating for the addition of new material, and a critical presentation of standard events and figures. (Zimmerman, 2005). The revised standards were not as progressive as the first proposed, providing more of an outline for states and districts to form their own curriculum. It is not the exact result of any specific “history war” in this country’s past that was formative of today’s curriculum standards or mandating processes. It is of greater importance that these moments quickly turned to political, social, and culture wars, through which players fought for which morals, identities, and collective national image would be propagated in schools, through the curricular content which would find itself in new textbooks. In the midst and following the public national debacle surrounding the national standards, in the 1990’s, the main power to create and enforce curriculum fell on the state and local level.

This nation’s historical controversy and disagreement over history has lead to the current climate in which “no promo homo” laws can continue to influence school climate and curriculum. There are no nationally mandated curriculum standards, however the department of education does protect against discrimination “on the basis of race, color, and national origin, sex, disability, and on the basis of age,” (United States Department of Education). This lack of explicit protection in combination with the long-standing controversial and subjective nature of history/social study standards, give states and local districts have the power to either deny these students a positive, inclusive experience.

The Necessity of LGBT-Inclusive Curriculum

California is the only state which features language requiring the explicit inclusion of positive representation of LGBTQ figures and historical contributions. Other than the seven previously mentioned states with “no promo homo” laws, no other states have specific curriculum guidelines in this area, however, this alone is not sufficient. By not passing inclusive standards, these states remain complicit in the adversity faced by LGBTQ students by allowing their history and identities to go unrepresented. The benefits of inclusive curriculum benefit all students, and build a healthy climate for LGBTQ identified students.  

The two main subject areas which topics of LGBTQ history and issues arise are in health education and history and social studies (Snapp, Burdge, Licona, Moody, & Russell, 2015). Most of states “no promo homo” laws were passed in the 1980’s and 90’s in response to the AIDS crisis and with the rise of anti-LGBTQ inclusive laws and policy (Lambda Legal, n.d.). These laws, for the most part, are focussed on health and sex education, but their reach does not stop there, often affecting teachers willingness and ability to talk about LGBTQ issues, including harassment or mistreatment within the school (Lambda Legal, n.d.). This creates a culture of silence and shame surrounding the student’s’ identity. Of students who reported incidents,  63.5% said that school staff did not respond or told the student to ignore it. 16.7% were prohibited from discussing or writing on LGBTQ topics for their assignments, while an additional 16.3% were prohibited from doing so in their extracurricular activities (The 2015 National School Climate Survey).

Inclusive curriculum appears most often in history and social studies classrooms (Snapp et. al., 2015). These sections in the curriculum may have positive impacts on students who identify as LGBTQ, but they can easily fall short of their full potential. These lessons are often taught as stand alone topics, and the connections to broader social justice work and can often be missed (Snapp et. al., 2015). Educators can miss valuable teaching moments, even if they are trying their best to incorporate these topics. This speaks to the importance of a structured curriculum reflected in the textbook and teaching materials teachers use. Inclusive curriculum not only teaches all students about specific events and figures important to the LGBTQ community, it also increases the awareness of the obstacles and challenges these students face. Non LGBTQ identifying students may be able to appreciate and acknowledge the difficult position of their peers more, and empathize with them when presented with history and current events in particular. It can also be related to other issues of social justice, and equal rights which students may have learned about beforehand, encouraging them to recognize and relate the injustice and discrimination faced by the LGBTQ community as similar to that faced by other groups (Athanases & Larrabee, 2003).

At schools with inclusive curriculum, LGBTQ students are psychologically healthier, and perform better in the classroom (Russell, Fish, 2016). They are more supported, miss less classes, and experience fewer instances of harassment and bullying. Overall, these factors contribute to a safer climate which is fostered by these students’ peers and teachers. The two most effective factors in encouraging students to stop bullying and harassment is witnessing teachers intervene to stop harassment and, most of all, seeing other students do so (Wernick, Kulick, & Inglehart, 2013). By introducing curriculum which demystifies and illuminates LGBTQ history and issues, students will be more likely to actively speak out against negative remarks, and bullying. This creates a positive cycle in which other students would be engaged, improving the overall culture and climate of the school.

The perceived safety of LGBTQ students by their peers has been shown to be an indicator of the heteronormative school culture (Toomey, McGuire, & Russell, 2012). In schools with more inclusive curriculum, students reported a safer environment for their LGBTQ, and specifically gender nonconforming peers. These students perceived safety, may not reflect their reality as many still report high instances of harassment.  

Students who attend schools with LGBT inclusive curriculum experience also less verbal and physical harassment and assault. According to GLSEN 2015 School Climate report, 40.4% of students felt unsafe because of their sexual orientation as opposed to 62.6% in schools without inclusive curriculum, 18.6% of students missed school in the past month as opposed to 35.6%. In these environments, LGBTQ students feel more welcomed and accepted by their peers, reporting hearing “gay” used often in a negative way 49.7% opposed to 72.6%, and general homophobic remarks 40.6% opposed to 64.1% of students. They were also more likely to report their classmates were somewhat or very accepting of LGBTQ people, 75.8% compared to 41.6% (The 2015 National School Climate Survey).    

Students who feel unsafe and victimized at school have poorer academic performance and lower rates of pursuing higher education.
From GLSEN 2015 School Climate Report (“The 2015 School Climate…”

Overall, positive representation in the classroom improves the school environment by educating all students, but only 22.4% of LGBTQ students reported being taught positive representation about LGBTQ people, history, or events and 17.9% had been taught negative content (The 2015 National School Climate Survey). Less than half of students reported being able to find information about LGBT-related issues in their school library. This shows that having no requirements is not enough to promote an inclusive environment. The standard cannot be set so low, that the simple absence of discriminatory laws is seen as exemplary.

California: An Agent For Change

In 2012, California became the only state mandating LGBTQ inclusive curriculum standards. The changes to the law were minimal. The bill which introduced these changes did not change any of the state’s standards or curriculum directly. It did, however, ensure that schools and districts make efforts to actively include positive representation of LGBTQ figures. Among other previously underrepresented groups “lesbian, gay, bisexual, and transgender Americans” were added to the section mandating the “ study of the role and contributions… to the economic, political, and social development of California and the United States of America, with particular emphasis on portraying the role of these groups in contemporary society” (California Department of Education).

The other main change which this bill initiated was new requirements for textbooks and other educational materials. “Education Code Section 60040 directs governing boards to only adopt instructional materials that accurately portray the cultural and racial diversity of our society” (California Department of Education.). Education Code Section 51501 and Section 60044 outline similar  prohibitions on instructional materials “reflecting adversely upon persons because of their race, sex, color, creed, handicap, national origin, or ancestry”; this bill added “sexual orientation” to the list (S.B. 48, 2011).

It can be seen in the Center for Disease Control’s report on “Sexual Identity, Sex of Sexual Contacts, and Health-Risk Behaviors Among Students in Grades 9–12” that LGBTQ students in California experience less harassment and bullying at school. In the figure below, the difference in percentage of heterosexual, and gay, lesbian, and bisexual students bullied on school property is much lower in California than Oklahoma, the only state with reported figures which has “no promo homo” laws. Oklahoma has the second highest percentage of LGBTQ students reporting being bullied on school property, and the highest difference between heterosexual and LGBTQ students, at near 30% more.

Percentage of high school students who were bullied on school property. From (Centers for Disease Control and Prevention)

In California students at several grade levels will learn appropriate topics such as different, diverse types of family structure, landmark cases, and the history of the modern gay rights movement. Perhaps the most widespread effect of this bill will be the new textbooks and instructional materials districts adopted in the 2016-17 school year (California Department of Education). The new standards will be reflected in materials adopted for grades k-12. Surrounding states will have access to these materials as well, and opportunity to adopt them, and mold their own curriculum to the new materials. This has the potential to create a ripple effect of inclusive curriculum in schools and districts; the majority of the work has been done, these materials need only be adopted, and these topics integrated into classrooms.

Considering Implementation

Implementation of LGBTQ inclusive curriculum faces barriers at both the state and local levels. As seen throughout history, political and social landscape of the region dictates most of the discussion and action surrounding what curricular standards are adopted. However, “no promo homo” laws are not invincible. In 2017, Utah’s Senate Bill 0196 “repealed language prohibiting the advocacy of homosexuality in health instruction”, becoming one of the first states to repeal their “no promo homo” law in recent history. The legislation came after the group Equality Utah filed a lawsuit in Salt Lake City’s U.S. District Court, against Utah public school districts, which “asked a federal judge to strike what it calls anti-lesbian, -gay, -bisexual and -transgender curriculum laws because they are unconstitutional and violate First Amendment rights to free speech, 14th Amendment rights to equal protection and laws that prohibit sex discrimination and equal access” (Noble, 2016).

The state, and public school districts, have no real legal authority to promote heterosexuality or gender conformity in schools, just as they have no authority to promote homosexuality (Duggan, 1994; Hunter, 1993; Lugg, 2003; Rosky, 2013). Every student has a default right to be heterosexual, but every child also has the same right to identify as LGBTQ. To limit homosexual or LGBTQ-reated speech is a violation of free speech protections under the First and Fourteenth Amendments, and to limit a student’s LGBTQ status is a form of animus against them that violates the equal protection guaranteed under the Fifth and Fourteenth Amendments, to targets students LGBTQ relationships (Rosky, 2013).

Two main arguments against the inclusion of LGBTQ curriculum are based on moral or religious grounds, or the grounds of the legality of homosexuality. However, including LGBTQ figures in the classroom does not infringe upon other’s right to freedom of religion and practice. In 1987, the Sixth Circuit Court of Appeals wrote in the curriculum case Mozert v. Hawkins, “governmental actions that merely offend or cast doubt on religious beliefs do not on that account violate free exercise” (Lugg, 2003).  Parents have the right to teach their own children what they please, but they do not have the right to restrict important and vital information from their children across subjects of sciences, sociology, or psychology; students have the right to their own informed opinion (Lugg, 2003). There is also nothing inherently criminal about identifying as LGBTQ. Since Lawrence v Texas in 2003 federally overturned sodomy laws, and Obergefell v. Hodges legalized same sex marriage in 2015, homosexual identity and conduct is federally protected, even though some “no promo homo” laws still reference invalid state laws regarding these rights.  

This being said, the responsibility of implementation should fall on the state and local levels, but the burden of enforcement in the face of possible legal contention should be taken up on a national level. The United States Department of Education currently does not include the words “sexual orientation” or “gender identity” in its anti discrimination policies. By adding these to the existing protection, “no promo homo” could legally be targeted as discrimination.

Conclusion

It is not only important to move towards inclusive curriculum, it is imperative to the wellbeing and education of LGBTQ identifying students. “No promo homo” laws infringe upon these students’ rights, and blatantly promote discrimination and mistreatment. LGBTQ students face significantly higher rates of harassment and miss more classes because they feel uncomfortable or unsafe. These risk factors lead to overall higher rates of negative outcomes including high dropout rates, lower rates of pursuing higher education, and higher mental illness prevalence and suicide rates. The regions where most of the “no promo homo” states lie, the south and midwest, have the highest demand for crisis intervention services provided by organizations, such as the Trevor Project, this could be attributed to the lack of other institutional supports offered at school or in the community (The Trevor Project, 2017).

All children deserve the opportunity to a safe, inclusive educational environment. LGBTQ students face numerous additional challenges in their everyday lives. In order to relieve the additional strain on these students, states must take the first proactive steps. The legality of “no promo homo” laws was challenged and overturned in Utah, and the model for inclusive curriculum has been created in California. States not only have the power to abolish these hateful practices, and implement inclusive policies, they have the obligation to do so in order to ensure the quality of education for LGBTQ students.

Works Cited

Alabama Code Title 16. Education § 16-40A-2 (1975)

Applebee, A. N. (1996). Curriculum as conversation: transforming traditions of teaching and learning. Chicago: University of Chicago.

Arizona Revised Statutes Title 15. Education § 15-716.

Athanases, S. Z., & Larrabee, T. G. (2003). Toward a consistent stance in teaching for equity: Learning to advocate for lesbian-and gay-identified youth. Teaching and Teacher Education, 19(2), 237-261.

Biegel, S., & Kuehl, S. J. (2010). Safe at school: Addressing the school environment and LGBT safety through policy and legislation.

California Department of Education. (2017, March 3). Senate Bill 48. Retrieved April 30, 2017, from http://www.cde.ca.gov/ci/cr/cf/senatebill148faq.asp

Centers for Disease Control and Prevention.”Sexual Identity, Sex of Sexual Contacts, and Health-Risk Behaviors Among Students in Grades 9–12″ — Youth Risk Behavior Surveillance, Selected Sites, United States, 2001–2009. MMWR Early Release 2011;60: June 6, 2011

Duggan, L. (1994). Queering the state. Social Text, (39), 1-14.

Eskridge Jr, W. N. (2000). No promo homo: The sedimentation of antigay discourse and the channeling effect of judicial review. NYUL Rev., 75, 1327.

Gay, L., & Network, S. E. (2011). Teaching Respect: LGBT-‐Inclusive Curriculum and School Climate(Research Brief). New York, NY: Gay, Lesbian and Straight Education Network. Retrieved on July, 18, 2014.

Graff, G. (1993). Beyond the culture wars: how teaching the conflicts can revitalize American education. New York: W. W. Norton.

Hunter, N. D. (1993). Identity, Speech, and Equality. Virginia Law Review, 1695-1719.

Kosciw, J. G., Greytak, E. A., Giga, N. M., Villenas, C. & Danischewski, D. J. (2016).

The 2015 National School Climate Survey: The experiences of lesbian, gay, bisexual, transgender, and queer youth in our nation’s schools. (2015) New York: GLSEN.

Lambda Legal (n.d.) “#DontEraseUs: FAQ About Anti-LGBT Curriculum Laws.” Retrieved April 30, 2017, from http://www.lambdalegal.org/dont-erase-us/faq#Q4

Lugg, C. A. (2003). Sissies, faggots, lezzies, and dykes: Gender, sexual orientation, and a new politics of education?. Educational Administration Quarterly, 39(1), 95-134.

McGarry, R. (2013). Build a curriculum that includes everyone. Phi Delta Kappan, 94(5), 27-31.

Nash, G. B., Crabtree, C. A., & Dunn, R. E. (2000). History on trial: culture wars and the teaching of the past. New York: Vintage Books.

Noble, M. (2016, November 07). Equality Utah – In a national first, LGBT advocates sue Utah schools over ‘anti-gay’ laws. Retrieved April 30, 2017, from https://www.equalityutah.org/newsroom/item/227-in-a-national-first-lgbt-advocates-sue-utah-schools-over-anti-gay-laws

Rosky, C. J. (2013). No promo hetero: Children’s right to be queer.

Russell, S. T., & Fish, J. N. (2016). Mental health in lesbian, gay, bisexual, and transgender (LGBT) youth. Annual review of clinical psychology, 12, 465-487.

S.B. 196, Utah (2017) (enacted).

S.B. 48, California (2011) (enacted).

Snapp, S. D., Burdge, H., Licona, A. C., Moody, R. L., & Russell, S. T. (2015). Students’ perspectives on LGBTQ-inclusive curriculum. Equity & Excellence in Education, 48(2), 249-265.

Stainback, S. (1994). Curriculum considerations in inclusive classrooms: facilitating learning for all students. Baltimore, Md: Brookes.

The Trevor Project. (2017). Retrieved April 30, 2017, from http://www.thetrevorproject.org/pages/facts-about-suicide

Toomey, R. B., McGuire, J. K., & Russell, S. T. (2012). Heteronormativity, school climates, and perceived safety for gender nonconforming peers. Journal of adolescence, 35(1), 187-196.

United States Department of Education, Office of Civil Rights. (2015, October 16). Know Your Rights. Retrieved April 30, 2017, from https://www2.ed.gov/about/offices/list/ocr/know.html?src=ft

Wernick, L. J., Kulick, A., & Inglehart, M. H. (2013). Factors predicting student intervention when witnessing anti-LGBTQ harassment: The influence of peers, teachers, and climate. Children and Youth Services Review, 35(2), 296-301.

Zimmerman, J. (2005). Whose America?: culture wars in the public schools. Cambridge, MA: Harvard University Press.

The Opposite of TFA: A National Teacher University to Build the Teaching Profession

The Opposite of TFA: A National Teacher University to Build the Teaching Profession

Tom Chu and Billy Roberts

Executive Summary

This policy report outlines a proposal for the National Teacher University (NTU), including both a graduate education program and an undergraduate program, which would be fully funded by the federal government and run by professional educators, researchers, and academics. NTU is designed to functionally resemble the U.S. military academies, with free tuition for all students and a mandatory five year public school teaching commitment after graduation. Specifically, NTU would ensure the presence of three critical aspects of teacher preparation: (1) content knowledge, (2) pedagogical methods and theory, and (3) teaching experience and mentorship.

NTU would benefit U.S. education in the following ways:

  • Build the teaching profession by ensuring teacher commitment.
  • Help increase teachers’ influence in policy by increasing respect for educators.
  • Combat teacher shortages and attrition.
  • Attract more teachers of color and low-income teachers.
  • Establish a model of exemplary teacher training.

Although implementation would be quite difficult, especially given the current political climate, the benefits to our education system would far outweigh any startup or maintenance costs.

Introduction

Most of us remember having a teacher who truly changed us. Maybe that teacher was special because they got along with you on a personal level; they understood you. Maybe that teacher was special because they showed you what was so interesting about a subject you had never before enjoyed. Maybe that teacher was special simply because they made class a place where you felt comfortable exploring and being yourself. Such an educational experience can have a truly profound impact on the trajectory of a student’s life, and it is not one that should be reserved for only a small subset of students with access to good teachers. As the United States searches for educational reforms that will revitalize our nation’s schools, it is imperative that teacher preparation programs occupy the forefront of reform efforts. If our schools are to provide as many students as possible with transformative educational experiences, teachers must be adequately trained in extensive teacher education programs. In the preface to her book Powerful Teacher Education: Lessons from Exemplary Programs, Linda Darling-Hammond (2012) writes that “one of the most damaging myths prevailing in American education is the notion that good teachers are born and not made.” It is time that the federal government act to dispel this falsehood, advocating for a norm of highly and traditionally trained teachers through the creation of its own teacher preparation program. The national teacher university outlined in this proposal is meant to accomplish exactly that–and we believe that it represents an important step toward ensuring quality teachers for all.

Background

Education policy discourse in the U.S. over the last three decades has increasingly focused on teacher quality and accountability. Around the time of the publication of A Nation at Risk in 1983, teacher quality and preparation entered the spotlight of policy talk and have since received significant political attention (Lewis & Young, 2013). In 1996, the National Commission on Teaching & America’s Future (NCTAF) published an influential report entitled What Matters Most: Teaching for America’s Future, outlining a vision of reform for teacher preparation programs, among other measures, to improve teacher quality (Hunt, 1996). Teacher quality was once again highlighted in No Child Left Behind (NCLB) (2001), which stressed teacher accountability and included provisions that teachers must be “highly qualified” in the subject areas they teach (Redding & Smith, 2016). A wealth of research demonstrates the importance of teacher quality and, specifically, teacher preparation (Darling-Hammond, 2010; Clotfelter, Ladd & Vigdor, 2007; Goldhaber & Brewer, 2000).

Yet, within this broad trend of increasing focus on teacher quality, competing visions for change in the realm of teacher preparation have developed, forming a “professionalization versus deregulation debate” (Lewis & Young, 2013, p. 209). One school of thought holds that “deregulating” the teaching field, by increasing Alternative Certification (AC) pathways, will allow experienced professionals or bright, elite young college graduates with content expertise to enter the teaching profession (Lewis & Young, 2013). Advocates of deregulation originally supported TFA, Relay Graduate School of Education (Relay GSE), and other AC measures because of a belief that these programs would help to alleviate teacher shortages (Kopp, 2001). Their logic held that despite limited preparation, having AC teachers would be much better than having no teachers at all in areas experiencing shortages. It is only more recently that TFA and AC supporters have begun to assert that much of the content of TPPs is superfluous or could be dramatically expedited, and teachers prepared through AC, because of their superior pedigrees, will actually outperform traditionally prepared teachers (Brewer, 2016).

On the other side, Linda Darling-Hammond, NCTAF, and other scholars and organizations advocate for the professionalization of teaching through increased clinical preparation and the standardization of preparation programs (Darling-Hammond, 2005; Sutcher, Darling-Hammond, & Carver-Thomas, 2016; Hunt, 1996). Proponents of professionalization emphasize measures such as new teacher mentoring and induction, in-classroom experience, observation of master teachers, exposure to pedagogical theory and methods, and university-based Traditional Preparation Programs (TPP) (Darling-Hammond, 2005; Darling-Hammond, 2010; Hunt, 1996). They believe that by better preparing teachers and creating a culture of dedication to the profession, TPPs can reduce teacher attrition and improve improve teacher preparedness and efficacy.

Proposal

In light of this ongoing debate, we add our voices to those in favor of professionalization, as we propose creating the National Teacher University (NTU), a teacher preparation university fully funded by the federal government. NTU would offer a full undergraduate liberal arts curriculum with an additional focus on pedagogy, developmental psychology, educational theory, and student teaching. This undergraduate curriculum would be coupled with a two-year graduate program in education, which would be open to both NTU undergraduates and students from other undergraduate institutions. Attending NTU would be free for all students, and they would receive a monthly stipend for their service–similar to how students at the U.S. military academies receive a tuition-free education and a monthly stipend. But also like the military academies, which require post-graduate military service of their students, students who attend NTU would be contractually obligated to teach in U.S. public schools for five years after graduation.

NTU follows the logic of professionalization, emphasizing more rigorous teacher preparation as the means of improving teacher commitment and efficacy. To some extent, comparing between TPPs and AC programs monolithically is ineffective because there is a huge degree of variation within each category, and focusing on the specifics preparation might be more important (Borman, Mueninghoff, Cotner & Frederick, 2009). However, we still advocate for TPPs, because our vision of exemplary teacher preparation, outlined below, includes extensive training not possible in abbreviated AC programs.

Specifically, as a model, NTU would ensure the presence of three critical aspects of teacher preparation: (1) content knowledge, (2) pedagogical methods and theory, and (3) teaching experience and mentorship.

First, content knowledge is crucial in light of evidence that teachers who have a degree in their subject field perform significantly better than those who do not, particularly in math and the sciences (Goldhaber & Brewer, 1996). Undergraduates at NTU would choose to major in a content area such as history or mathematics, while also completing pedagogical coursework and participating in supervised student teaching. Applicants to the graduate program would be required to have completed a major in a content area or have some content knowledge alongside an education major, such as Mathematics Education. Second, exposure to pedagogical methods and theory is vital to teacher preparation. AC programs usually contain pedagogical instruction, but they emphasize more practical concerns such as classroom management, neglecting pedagogical theory and methods (Redding & Smith, 2016). Both the graduate and undergraduate programs would require such theory and methods coursework, including focuses on child development and training in curriculum selection. New teachers who have received such training feel more prepared and have lower attrition rates than those who have not (Darling-Hammond, Chung & Frelow, 2002; Darling-Hammond, 2010; DeAngelis, Wall, & Che, 2013). Third, both the graduate and undergraduate programs would incorporate clinical experience into candidates’ preparation, which has likewise been shown to contribute to feelings of preparedness and low attrition rates (Darling-Hammond et al., 2002; Darling-Hammond, 2010; DeAngelis et al., 2013). The result of these three aspects of teacher preparation would be to create an attitude of reflective development in a teacher candidate’s pedagogy (Borman et al., 2009). Academic content, child development theory, and pedagogical theory would undergird and inform candidates’ practice in the classroom. Their clinical experiences and interactions with mentor teachers would allow them to constantly improve their practice, eventually entering their own classrooms feeling prepared, confident, and committed to the profession.

Ultimately, in recommending that the federal government create a national teacher university, we hope to address the following issues: a lack of respect for the teaching profession and teachers, which undermines efforts at recruiting and retaining good teachers; a shortage of teachers of color and teachers from low-income backgrounds; and an incoherent and eclectic mix of teacher preparation programs nationally, exacerbated by the diverse range of teacher accreditation qualifications between states.

Professionalization of Teaching Culture

First, the establishment of a national teacher university would build respect for teachers and the teaching profession, creating a culture of commitment and combatting teacher turnover. NTU’s university-based nature, post-graduation service requirement and extensive teaching-specific preparation would lead candidates to view teaching as a respected, lifelong profession. NTU’s service requirement, unlike TFA’s, would come with an expectation, communicated through the university’s mission, publications, media, and faculty, that teachers stay in the classroom indefinitely. As demonstrated in Figure 1, TPP graduates, who make up the about 80% of new teachers generally (Redding & Smith, 2016), are already much more likely than TFA teachers to view teaching as a temporary occupation rather than a lifelong career. This is significant because teachers who view teaching as a lifelong commitment have lower turnover rates and usually only leave the profession for unavoidable events in their personal lives, as opposed to complaints regarding working conditions (Hong, 2010; Donaldson & Johnson, 2011).  Similarly, multiple studies have reported lower attrition rates for graduates of TPPs than for TFA participants (Redding & Smith, 2016; Heilig & Jez, 2010). By lowering the “barriers to entry,” TFA and other AC programs deprofessionalize teaching, slashing teacher commitment (Brewer, 2016). NTU’s model would have the opposite effect, resulting in more teachers staying in the classroom, improving their pedagogy, and lowering the substantial costs of hiring and inducting new teachers.

Figure 1: New Teachers’ Commitment to the Teaching Profession


Source: Donaldson & Johnson, 2011; Farkas, Johnson & Foleno, 2000.

Additionally, NTU would lower teacher turnover and build the teaching profession by ensuring that new teachers are adequately prepared. As mentioned above, NTU’s focuses on content, pedagogy, and in-classroom experience have all been found to help develop confident, capable teachers who are more committed and less likely to leave the profession (Darling-Hammond et al., 2002; DeAngelis et al., 2013). A survey of new teachers (with five or fewer years of experience) even shows that many would support measures similar to the ones NTU would implement (see Figure 2), further bolstering the case for extensive preparation.

Figure 2: New Teacher Opinions on NTU Policies

Source: Farkas, Johnson & Foleno, 2000.

Increasing Teacher Influence

NTU would help create a more teacher-oriented paradigm of educational reform, building respect for teachers. First, creating a well-prepared teacher corps and building respect for the profession would foster a policy environment where teachers’ opinions are valued. From a review of education policy change in the 20th century, Tyack and Cuban (1995) conclude that because of their unique position on the ground, teachers inevitably shape the implementation of all policy. Therefore, effective education reform must be led by teachers, or at the very least, developed in constant consultation with them. In accordance with this, concrete policies, beyond the scope of this paper, would have to be implemented in the U.S. education landscape more generally in order to formally secure teachers’ influence, but the formation of NTU would go a long way towards shifting social perceptions in favor of such policies. Second, NTU would equip candidates with the knowledge to meaningfully contribute to policy discussions. NTU would not espouse any one specific pedagogy or vision of education, instead promoting a culture of critical dialogue between the competing theories of pedagogy and education policy covered in classes. Teachers would carry their knowledge and this culture of contemplation and critical discussion with colleagues into schools, equipping them to collectively change policy. Using the methods laid out above, NTU would invert the TFA’s paradigm of reform, enabling teachers to lead, instead of enabling future leaders to teach.

Amplifying teachers’ voices would also increase teacher satisfaction and lower attrition, since many teachers who choose to leave the profession complain of low autonomy and influence in their workplace (See Figure 3).

Figure 3: Former Public School Teachers’ Comparison of Teaching to Current Profession

Combatting Teacher Shortages and Teacher Attrition

For multiple reasons, the National Teacher University would draw many applicants and therefore help alleviate predicted teacher shortages. The university’s financial scheme would be a major draw for all prospective students, especially those who are low-income. Financial constraints often discourage students from choosing relatively low-wage jobs such as teaching, and can deter students from going to graduate school and even college (Rothstein & Rouse, 2011; Callender & Jackson, 2005). Fully funding tuition for future teachers would partially alleviate this burden by eliminating student loans and debt from the equation, drawing more teachers into the profession. Similarly funded government military academies like West Point draw over ten thousand applications per year and have acceptance rates around 10% (Princeton Review, 2017). The National Teacher University has the potential to enroll a similar number of students, and by eliminating financial concerns and drawing interest, media attention, and prestige to teaching, NTU would go a long way toward filling the massive incoming teacher shortage predicted by Sutcher, Darling-Hammond, and Carver-Thomas (2016).

Also, as discussed previously, NTU would combat shortages by mitigating teacher turnover in the following ways: it would increase teacher commitment and give teachers extensive preparation and experience, fostering feelings of self-efficacy and preparedness that correlate to retention (Darling-Hammond et al., 2002; Darling-Hammond, 2010; DeAngelis et al., 2013).

Providing Pathways for Teachers of Color

NTU’s financial scheme would also result in increased opportunities for people of color. The two year graduate program would be open to applications from all candidates with a bachelor’s degree in a relevant content area. Thus, the National Teacher University would provide a comprehensive yet financially viable pathway for graduates of color and professionals to enter the teaching profession.

Teachers of color have been shown to benefit the education of all students, and especially benefit students of color, as they can better serve as role models, mentors, and advisors because of shared experiences (Irvine, 1988; Villegas & Irvine, 2010; Griffin & Tackie, 2017). But despite these proven benefits, the U.S. teaching force does not reflect the racial diversity of its students, as Black and Latinx teachers, particularly men, are severely underrepresented (Ingersoll & May, 2014). As Figure 4 indicates, the percentage of public school teachers who are non-white has not increased markedly among any group except Hispanic teachers, despite the growth of AC programs over the same time period.

Figure 4: Percentage of Public School Teachers who Are Teachers of Color

Source: National Center for Education Statistics, 2015

Advocates of AC programs often assert that these kinds of programs are necessary to recruit more teachers of color, providing low-cost pathways for professionals who already hold a bachelor’s degree and want to enter the teaching profession (Madkins, 2011; Whitmire, 2016). However, as one reporter writes, we “can do better for minority teachers than Relay GSE” (Anderson, 2016). Relay GSE, an AC program developed by charter school leaders, and other programs like it, “expedite” coursework on pedagogy, in-classroom experience for teachers, and largely neglect content knowledge, assuming candidates are already proficient (Borman et. al, 2009). This is significant because Ingersoll and May (2014) conclude that shortages of teachers of color persist not because of poor recruitment of teachers of color, but because of poor retention. Teachers who feel unprepared are more likely to leave the profession than well-prepared teachers (Darling-Hammond et al., 2002), so expanding AC programs in the hopes of increasing the percentage of teachers of color would be futile.

Instead, the National Teacher University would provide a comprehensive yet financially viable pathway for people of color to enter the teaching profession. They would receive the in-classroom experience, exposure to pedagogical methods, and mentoring that they, like all teacher candidates, deserve, preparing them for a career in teaching.

Model for Teacher Preparation

Finally, the National Teacher University would be able to serve as a model program for other universities looking for guidance in creating their own curriculum for teacher education. There has recently been significant debate about the quality of traditional teacher preparation programs in the U.S., with the National Council on Teacher Quality issuing a scathing report on their content, structure, and performance (Greenberg, McKee, & Walsh, 2013). This report and others also highlight the large amount of quality variance currently present in preparation programs (both TPP and AC), specifically noting the dearth of high-quality programs and skew towards poor performance. For example, AC programs can vary anywhere from providing teacher candidates with a mere five to six weeks of preparation over a summer, to a two year program with concurrent university coursework, teaching experience, and mentoring (Borman et al., 2009; Darling-Hammond et al., 2002). If the federal government were to establish a nationally sponsored teacher education program, ensuring that its curriculum and philosophy were informed by research and evidence-based practices, it would create a national model for other universities to emulate and look to for reform ideas. Such a centralized structure resembles the system that the education titan Finland currently uses to educate its teachers, wherein universities have autonomy in devising curricula, but the federal government provides them with guiding principles and requirements to ensure consistency and quality outputs (Niemi & Jakku-Sihvonen, 2011).

In addition to modelling an effective teacher preparation program, the National Teacher University would also help to develop a national standard for teacher accreditation. Because of No Child Left Behind (2001) and its Highly Qualified Teachers provision, states across the country lowered their requirements for teachers with content knowledge to become certified and opened the door to a broad array of AC routes (Baines, 2010). This influx of teachers coming from outside the traditional teacher pipeline diluted the quality of teachers in the workforce and has had deleterious effects on education as a whole (Baines, 2010). The National Teacher University would offer a federally endorsed standard for teacher accreditation, which until now has not existed except–marginally–in the vague and inadvertently perverse terms included in the No Child Left Behind Act (2001) and the Every Student Succeeds Act (2015).

Implementation

The National Teacher University would admittedly be a difficult project to develop. Possibly the most daunting challenge is that NTU would require significant startup costs for a campus and facilities, coupled with a large annual budget for faculty and all the expenses of a university. We believe that such a vision is not impossible, though, given the historic success and sustainability of U.S. military academies, with their large budgets, high prestige, and excellent performance. For this to happen, our country simply has to stand by its rhetoric in A Nation at Risk that places education as a national priority on par with defense. Additionally, hiring a full staff of qualified education professors and liberal arts professors for the undergraduate university would be a major challenge. There would likely be high costs associated with recruitment, but, ultimately, we believe that NTU’s model and theory would make it an attractive destination for prominent researchers, academics, and educators. In terms of certification, NTU would have to work with states to offer accreditation to university graduates, which might be difficult in light of the current inter-state variation in certification requirements (Boyd, Goldhaber, Lankford & Wyckoff, 2007). And although we believe that there are sufficient students nationally who would be interested in attending NTU to create a competitive admissions process, it is unclear how much interest the program would draw from applicants in light of the five-year teaching commitment. Of course, the countervailing forces would be the free tuition and the prestige that would ideally accompany a degree from the university.

Critics might object to the fact that the federal government would, in a sense, control the preparation and, therefore, the opinions and mindsets of teachers. In reality, although NTU would be funded by the federal government, the university’s curriculum would be left largely to the discretion of the professional educators, scholars, and researchers who work there, and the curriculum would reflect the most up-to-date and evidence-backed knowledge on effective methods of teacher education. In addition, criticism would be sure to arise from AC and deregulation proponents. Overall, there would evidently be myriad practical, legal, political, and bureaucratic challenges related to the establishment of NTU. But we believe that the benefits to the quality of our nation’s teachers and our education system as a whole make the task worthwhile.

Conclusion

Though NTU would not be a panacea for the myriad issues currently confronting teacher preparation and our education system more broadly, it represents an important shift in federal policy that would signal to the nation a new era has begun for teacher training and the profession as a whole. Beyond its symbolic importance, NTU would help to address issues of equity and access, of professional respect for teachers, and of variation in teacher training and accreditation. It is inexcusable that we know how to train effective teachers, and yet ineffective AC programs are still so prevalent, diluting the quality of teachers in the profession and perpetuating the myth that teaching is a skill that is innate or acquired only through trial and error. Our proposal offers a way to combat these troubling developments, helping to usher in a new norm for teacher training that resembles successful international models.

Every child deserves a teacher well versed in the art of teaching; who is professional and prepared; who understands the nuances of pedagogy and developmental psychology; who is resourceful and knowledgeable in a content area; and who has real teaching experience under a master teacher. These are not elusive qualities vested only in an elite few with some kind of teaching je ne sais quoi. Rather, these skills are honed through years of education and practice. And when they become fully developed, they can equip any teacher with the ability to provide a transformative educational experience.

Acknowledgements

This work would not have been possible without the thoughtful comments of Ben Wong and George Hyunh. We would also like to thank Dr. Mira Debs for her consultation and advice on the project. Their help has been integral to our work, and our project is stronger because of them.

Works Cited

Anderson, L. (Nov. 1, 2016). CT can do better for minority teacher candidates than Relay GSE. CT Viewpoints. Retrieved from https://ctviewpoints.org/2016/11/01/ct-can-do-better-for-minority-teacher-candidates-than-relay-gse/.

Baines, L. A. (2010). The disintegration of teacher preparation. Educational Horizons, 88(3), 152-163.

Borman, K. M., Mueninghoff, E., Cotner, B. A., & Frederick, P. B. (2009). Teacher preparation programs. In International handbook of research on teachers and teaching (pp. 123-140). Springer US.

Boyd, D., Goldhaber, D., Lankford, H., & Wyckoff, J. (2007). The effect of certification and preparation on teacher quality. The Future of children, 45-68.

Boyd, D., Grossman, P., Lankford, H., Loeb, S., & Wyckoff, J. (2006). How Changes in Entry Requirements Alter the Teacher Workforce and Affect Student Achievement. NBER Working Paper No. 11844. National Bureau of Economic Research.

Brewer, T. J. (2016). An examination of Teach For America’s impact on the teaching profession, hiring practices, and educational leadership. Doctoral dissertation, University of Illinois at Urbana-Champaign.

Callender, C., & Jackson, J. (2005). Does the fear of debt deter students from higher education?. Journal of social policy, 34(04), 509-540.

Clotfelter, C. T., Ladd, H. F., & Vigdor, J. L. (2007). Teacher credentials and student achievement: Longitudinal analysis with student fixed effects. Economics of Education Review, 26(6), 673-682.

Darling-Hammond, L., Chung, R., & Frelow, F. (2002). Variation in teacher preparation: How well do different pathways prepare teachers to teach?. Journal of teacher education, 53(4), 286-302.

Darling-Hammond, L. (2005). Teaching as a profession: Lessons in teacher preparation and professional development. Phi delta kappan, 87(3), 237-240.

Darling-Hammond, L. (2012). Powerful teacher education: Lessons from exemplary programs. John Wiley & Sons. Print.

Darling-Hammond, L. (2015). The flat world and education: How America’s commitment to equity will determine our future. Teachers College Press. Print.

DeAngelis, K. J., Wall, A. F., & Che, J. (2013). The impact of preservice preparation and early career support on novice teachers’ career intentions and decisions. Journal of teacher education, 64(4), 338-355. Retrieved from http://journals.sagepub.com/doi/abs/10.1177/0022487113488945.

Donaldson, M., & Johnson, S.M. (Oct. 4, 2011). TFA teachers: How long do they teach? Why do they leave? Education Week. Retrieved from http://www.edweek.org/ew/articles/2011/10/04/kappan_donaldson.html.

Every Student Succeeds Act (ESSA) of 2015, 20 U.S.C. 6301 et seq.

Farkas, S., Johnson, J., & Foleno, T. (2000). A sense of calling: Who teaches and why. Public Agenda. Retrieved from https://www.publicagenda.org/files/sense_of_calling.pdf.

Goldhaber, D. D., & Brewer, D. J. (1996). Evaluating the effect of teacher degree level on educational performance. Westat, Inc.: Rockville, MD. Retrieved from https://eric.ed.gov/?id=ED406400.

Goldhaber, D. D., & Brewer, D. J. (2000). Does teacher certification matter? High school teacher certification status and student achievement. Educational evaluation and policy analysis, 22(2), 129-145.

Goldstein, D. (2014). The teacher wars: A history of America’s most embattled profession. New York: Doubleday Knopf.

Greenberg, J., McKee, A., & Walsh, K. (2013). Teacher prep review: A review of the nation’s teacher preparation programs. Retrieved from https://papers.ssrn.com/sol3/papers.cfm?abstract_id=2354106.

Griffin, A., & Tackie, H. (2017). Through our eyes: Perspectives from black teachers. Phi Delta Kappan, 98(5), 36-40.

Heilig, J.V. & Jez, S.J. (2010). Teach For America: A Review of the Evidence. Boulder and Tempe: Education and the Public Interest Center & Education Policy Research Unit.

Hong, J. Y. (2010). Pre-service and beginning teachers’ professional identity and its relation to dropping out of the profession. Teaching and teacher Education, 26(8), 1530-1543.

Hunt, J. B. (1996). Teaching for America’s future. Report of the National Commission on Teaching and America’s Future, Summary Report, New York.

Ingersoll, R., Merrill, L., & May, H. (2014). What are the effects of teacher education and preparation on beginning teacher attrition?. CPRE Research Reports.

Irvine, J. J. (1988). An analysis of the problem of disappearing Black educators. The Elementary School Journal, 88(5), 503-513.

Kopp, W. (2001). One day, all children…: The unlikely triumph of Teach for America and what I learned along the way. New York: PublicAffairs.

Lewis, W. D., & Young, T. V. (2013). The politics of accountability: Teacher education policy. Educational Policy, 27(2), 190-216.

Madkins, T. C. (2011). The black teacher shortage: A literature review of historical and contemporary trends. The Journal of Negro Education, 417-427.

National Center for Education Statistics (2015). Number and percentage distribution of teachers in public and private elementary and secondary schools, by selected teacher characteristics: Selected years, 1987-88 through 2011-12. Table 209.10. United States Department of Education: Washington, D.C.

National Commission on Excellence in Education. (1983). A nation at risk: the imperative for educational reform: a report to the Nation and the Secretary of Education. United States Department of Education: Washington, D.C.

Niemi, H., & Jakku-Sihvonen, R. (2011). Teacher education in Finland. European dimensions of teacher education: Similarities and differences, 33-51.

No Child Left Behind (NCLB) Act of 2001, 20 U.S.C.A. § 6301 et seq.

Redding, C., & Smith, T. M. (2016). Easy in, Easy out: Are Alternatively Certified Teachers Turning Over at Increased Rates?. American Educational Research Journal, 53(4), 1086-1125.

Rothstein, J., & Rouse, C. E. (2011). Constrained after college: Student loans and early-career occupational choices. Journal of Public Economics, 95(1), 149-163.

Sutcher, L., Darling-Hammond, L., & Carver-Thomas, D. (2016). A coming crisis in teaching? Teacher supply, demand, and shortages in the US. Learning Policy Institute.

The Princeton Review (2017). United States Military Academy. Admissions. Online.

Villegas, A. M., & Irvine, J. J. (2010). Diversifying the teaching force: An examination of major arguments. The Urban Review, 42(3), 175-192.

Whitmire, R. (2016). The founders: Inside the revolution to invent (and reinvent) America’s best charter schools. The 74 Media Inc.

The Myth of the Rural Attainment Gap: Rural Access to Higher Education and the Problem of the Education Desert

The Myth of the Rural Attainment Gap:

Rural Access to Higher Education and the Problem of the Education Desert

Franklin Eccher

Public Schools and Public Policy

Mira Debs

May 3, 2017

Introduction

The narrative of the state of rural education in America has largely been one of failure and the necessity of intervention. The 2016 election, especially, looms large in the national consciousness, with the caricature of the uneducated rural voter immediately becoming the monolithic symbol of Trumpism. Explanations of this voting phenomenon range from ignorance to resentment, but oftentimes fail to thoroughly empathize and understand the source and direction of those frustrations. Katherine Cramer, a political science professor from the University of Wisconsin perhaps identifies the problem more productively in her recent NPR interview, in which she says,

Many voters have racial and economic resentments, but the thing that surprised me in my research was how common it was for people in small towns to talk about these resentments with reference to their towns (Cramer, 2016).

“Rural resentment” is resentment with rural communities themselves, the victims now of aging, shrinking population demographics, more so than resentment with a certain party or figure.

At the heart of these rural communities ultimately lies their schools. An immediate gut-reaction to election analyses like FiveThirtyEight’s “Education, Not Income, Predicted Who Would Vote For Trump” (Silver, 2016), is to missionize the quest to bring education to rural communities. As I will argue in this paper, there is, assuredly, an opportunity gap between rural and urban students, especially on the developmental cusp of one’s choice whether or not to seek higher education. However, first, this is an opportunity gap, not an attainment gap, and a rural student’s choice whether or not to pursue higher education has much more to do with their expectation of success and a myriad of other social factors than any inherent ability to succeed. Further, a rural student’s decision to pursue higher education is also a geographic decision. To choose higher education is likely a choice to leave their rural community, which is both a deterrent from their decision to attend college and, once they have completed a degree, a deterrent from their decision to return home. Thus, the current state of rural education presents a paradox in which a suffering community struggles to send students to college at all, and then struggles to retain the talented students that it does send to college.

For those reasons, my proposed solutions center around improving rural access to higher education not solely in the spirit of educating Trump voters, but also in order to heal rural communities whose cultures depend so highly on their schools.

My paper will first explore the historical and political underpinnings of the current state of rural access to higher education, as well as attempts that have been made to alleviate existing problems. This background will preface my original data analysis concerning the longitudinal educational decision-making of rural students. I will then utilize this research to bolster a number of possible policy recommendations geared towards improving rural access to higher education and revitalizing rural communities.

Background

The dominant narrative of rural schools as one of failure is perhaps the most destructive element of the movement for improved rural access to higher education. Rural communities today stand at the end of a long history of economic and social transformation, and will continue to change far into the future. However, one relative constant in the history of rural communities is the essentiality of the school as the orbital center of a rural community’s culture and identity (Tieken, 2014). Much of the reason for this is that, even though many students “flee” for the cities after high school, rural communities have historically been home to more dependent children than cities (Reeves, 1945). With higher proportions of children and few opportunities for community gathering outside of the local school, school communities define rural communities. The historical post-secondary aspirations of these students as well as these interactions with their communities will compose the focus of my background.

Firstly, a thorough deconstruction of the meaning of the classifications of “rural” and “urban” has been and should continue to be explored. If the space was available here, I absolutely would. However, for my purposes throughout this paper I will operate under the conventional classification of “rural” as an “other” in relation to urban spaces, or as a “nonmetropolitan” geographic characterization (United States Census Bureau, 2010).

Rural schools have long struggled with both a real logistic disadvantage and a resulting disadvantage in perceived quality. The reasons for this are many. For one, attracting and retaining experienced, quality teachers in small, isolated, likely impoverished communities is a notable obstacle (Monk, 2007). Rural communities are also grappling with the reality of the changing nature of work in America. As low-skilled manufacturing labor continues to decline, job opportunity in rural communities are only becoming more scarce (Glasmeier & Salant, 2006). Rural schools also face a demographic problem: that qualified younger adults are more attracted to urban areas for increased job opportunity while older adults are attracted to rural communities for improved quality of life (Herzog & Pittman, 1995). These contrasting flows create rural communities with a high proportion of low-income adults and young people, and high-income older people with less of a stake in the schools that drive their community.

In part because of these difficulties, rural high school graduation rates and college enrollment have lagged notoriously behind those in urban districts, but this gap is continuing to close. In 1970, less than half of rural adults over 25 had a high school degree and less than one in ten had a college degree, while in 2000 more than three quarters had a high school degree and 15% had a college degree (Gibbs, 2005). Studies now disagree whether high school graduation rates are higher or lower for rural or urban students, largely hinging their arguments on varying rural classifications, a sign at least that rural high school graduation rates are pulling even (Jordan, Kostandini, & Mykerezi, 2012). However, college attendance is still notably lacking for rural students, a result of both cultural and geographic factors.

Cultural expectations and geographic deterrents continue to reinforce boundaries to higher education for rural students. Benjamin Robbins’s senior Sociology thesis at Yale, “’People Like Us Don’t Go There’: Local Culture and College Aspirations in Rural Nebraska” (2012), deals with the cultural aspect quite explicitly, drawing from in-depth interviews to tease out some of these factors at play. As I will explore briefly later on, rural students carry a larger assumption of failure with them in their entrance into higher education. Geographic education barriers have borrowed the colloquial term “Education Deserts,” referring to the literal absence of higher education facilities in sparsely populated areas of the country (Hillman & Weichman, 2016). Although vocational or two-year degree opportunities may be available, four year colleges in states like Wyoming and North Dakota are far and few between. With more than half of college students attending school within 50 miles of their home, this considerable distance is of concern.

That said, more rural high school graduates are attending college than ever before. As Laura Pappano’s consecutive New York Times articles earlier this year indicated, “Colleges Discover the Rural Student” (2017), and “Voices From Rural America on Why (or Why Not) to Go to College” (2017), there is a heightened sense of the value of rural perspectives in higher education. As the son of two fly-fishermen from rural western Colorado in my sophomore year at Yale, I believe I am somewhat of a product of this new awareness.

However, as the rural-urban higher education opportunity gap (arguably) narrows, of equal concern is the heightened effect of flight from rural communities, especially among talented students. This is ultimately the purpose of my following diagnosis: both to identify the current state of the rural/urban higher education gap and also to pinpoint the ways in which increasing access to higher education for rural students farther away from their communities, without encouraging their eventual return to those communities, may be doing harm in unintended ways.

Evidence/Data Analysis

Methods

For the purposes of this project, I utilized data from the National Longitudinal Survey of Youth (NLSY), which began in 1997 and was conducted over the course of 16 yearly rounds to the year 2013. Although further surveys may have been conducted in 2017, this data has yet to become available. The NLSY is a product of the National Longitudinal Surveys (NLS) program, directed by the US Bureau of Labor Statistics. The NLSY undertook a similar project in 1979 (NLSY79), which has seen more thorough investigation (at least in my own findings) than NLSY97. Both NLSY79 and NLSY97 began with a group of respondents aged 12 to 18 upon their first interview, and then followed up with those same respondents for a yearly round of follow-up interviews. Each respondent was coded with an ID that allows for the anonymous tracking of individual responses over the course of the 16 rounds. 8,984 respondents were interviewed in the first round, with an 80% retention rate of the sample size by round 16. NLSY97 is composed of two sub-samples, two thirds of which are designed to be representative of the US as a whole, and one third of which are designed to oversample Hispanic, Latino, and Black respondents. 51% of initial respondents were male, and 49% were female. Although my research did not explicitly explore the racial and gendered dynamics of the NLSY97 sample, any and all of these results can and should be cross-referenced with these variables I have explored for future study.

After seeing the NLSY79 data sourced in other works on this subject (e.g. Rural Education and Training in the New Economy, Gibbs et al.1997), I looked into the NLSY data myself and noted the essentiality of longitudinal data for my area of study. Longitudinal data specifically allows for both the minute and expansive tracking of flows over time, presenting not just a snapshot of a sample size at one time but instead a historical process of experiences and decision-making. With such an immense store of data, my research really only skims the surface.

Geographic Flows

Between 2010 and 2012, for the first time in American history, rural populations actually fell (Cromartie, 2013). Unsurprisingly for a cross-sectional sampling of American young adults, the NLSY97 data reflected this shift even before the more dramatic shift in 2010. While the 2010 – 2012 dip was likely also affected by the housing crisis and a slowing of recreation-based rural economies, representatives of the NLSY97 sample were beginning to urbanize as soon as they reached an old enough age to be able to feasibly move. I have, to some extent, simplified this relationship with this figure. I have removed those respondents that moved outside the US as well as those that, for whatever reason, were not interviewed in subsequent rounds. It is important to note that while the proportion of urban respondents rose, the actual number of urban respondents fell from 6090 to 5889, while the number of rural respondents fell much more dramatically from 2047 to 1118.

With such a dramatic flight from rural areas for these respondents, of course, the next logical question is simply why? For respondents on the cusp of their entry into or departure from post-secondary education, where they decide to go and if they decide to come back is key.

Figure 1: Geographic Place of Residence

Student Expectations

One critical element of a student’s decision to seek or not to seek higher education is their expectation of success or failure. One NLSY97 survey question from the year 2000 was administered as follows:

Now think ahead to when you turn 30 years old. What is the percent chance that you will have a four-year college degree by the time you turn 30?

At anywhere from age 15 to age 21, the answer to this question is likely to play a significant role in a child’s further educational decision-making. I have presented here the results of this survey question as both a mean and median in order to adjust for answers that may polarize a simple average. Although arguably slight, these survey results represent a clear doubt among rural students about their ability to succeed in a traditional 4-year Bachelor’s degree program.

Figure 2: Expectation of Degree Attainment by Age 30

Degree Attainment

For my first attempt to parse the educational attainment of rural and urban NLSY respondents, I looked solely at outcomes. After separating each student by their “rural” or “urban” coding in their initial 1997 survey results, I then tracked their degree attainment and type each year afterwards (with the exception of 2012, which was unavailable for this question). These results, especially in light of all of the rhetoric about the rural attainment gap, are surprising. If it seems as though these graphs are nearly identical, it is because they are. Not only the proportion of degree receivers, but also the rate at which they received those degrees, are nearly identical.

Figure 3(a): Degree Attainment Over Time – Rural Students

Figure 3(b): Degree Attainment Over Time – Urban Students

Conditional Attainment and Enrollment

However, as I discovered, looking solely at the outcome of a degree masked a number of other important factors, and I recognized that I needed to find a representation that more thoroughly explored the space in between successive degrees. As Gibbs writes in Rural Education and Training in the New Economy (1998):

The likelihood that a person completes college can be understood as the product of a succession of events, each conditional upon previous decisions. The college graduate must first acquire a high school diploma, then decide to attend college, and then complete a program of study. These decisions are determined by personal attributes and preferences as well as by family, labor market, and societal forces.

Table 1: Conditional Attainment Rates by Geographic Location (1997 Coding, 2013 Results)

As I have attempted to make clear with the above table, each percentage represents the proportion of the preceding demographic of respondents. Each of the six percentages within the two blue boxes is a proportion of those that graduated with any degree type. In representing the data conditionally instead of nominally, a statistic like “Went to College,” which is nearly identical between urban and rural respondents when taken as a proportion of the total number of respondents, becomes much more significant as a proportion solely of high school graduates. The four proportions I have highlighted in green represent two significant, possibly mutually-cancelling aspects of the above “Degree Attainment Over Time” representation (Figures 3(a) and 3(b)):

  1. More urban high school graduates than rural high school graduates attended at least some college.
  2. Of the rural students who attended college, more rural students completed a degree program than did urban students.

These two variables could possibly cancel each other out in that a) although a smaller pool of rural students are pursuing higher education, b) a higher proportion of those rural students are graduating. This is an especially salient point in the context of the above representation of student expectations (Figure 1). Even though rural students, on average, reported lower expectations, those that did pursue higher education found higher rates of success.

When Gibbs first explored the NLSY data from the 1979 cohort (Gibbs, 1998), he found a similar but wider gap between college enrollment rates (56% rural to 65% urban), and graduation rates that were nearly equal for 2- and 4- year programs (53% rural to 52% urban). While Gibbs observed nearly equal success among rural and urban college-goers, I would go so far as to say here that rural college-goers may even be finding more success than urban college-goers.

Likely due to availability of access, rural students obtain a notably larger proportion of 2-year degrees. However, the steep jump in 4-year degree attainment for rural students (up to 54.5% of rural degree holders from 39% between 1982 – 1989) could be an indicator of a larger movement to urban areas capable of providing those programs.

Where Are They Now?

There are all sorts of approaches to examining more deeply the geographic implications for these rural degree-seekers. The way that I chose, which overlooks many of the racial, socioeconomic, familial, cultural, and gendered factors that may be at play in this decision-making process, was to simply ask, “Where are they now?” To answer that question, I filtered for the students that were originally coded as “rural,” filtered for those that had attained any kind of degree higher than a high school diploma, and then tallied their geographic coding as of 2013. By the year 2013, even if a student had left their rural community for an urban community in order to attain their degree, there is a reasonable chance that they could have returned to their rural community. The average age of the NLSY97 respondents by the year 2013 was anywhere between ages 28 – 34, an age when those graduates may have been settling down, having children, and becoming homeowners. Strikingly, few respondents are returning to their rural communities.

Figure 4: Geographic Location of Participants from Rural Origins with a Degree Higher than High School (1997 Coding, 2013 Results)

This last representation demonstrates perhaps the most significant detrimental impact of the pursuit of higher education from rural communities. Without logistically-feasible access to higher education in their rural communities, those that take the risk of leaving for the urban areas that can provide that education are not coming back. In this way, “education deserts” are not only creating but exacerbating the problem. When the search for educational opportunity removes degree-seekers from their communities, those degree-seekers, with the greatest ability to motivate future rural students and to positively impact their communities, are no longer a resource.

Proposed Solutions

Thus far I have presented more diagnoses than prescriptions. Rural access to higher education is a sticky subject, one that is inseparable from the rural communities that produce rural high school graduates. I will present here a concise review of aspects that I find essential to supporting both rural students seeking higher education as well as the communities that rural college-goers leave behind.

  • Economic solutions are not the only solutions.

The Obama administration undertook a notable “rural revitalization” strategy in 2014 as part of a broader program to fight poverty which brought in Tom Vilsack, then the Secretary of Agriculture. Two of the five “promise zones” targeted in the program were rural areas, including one in the Choctaw Nation of Oklahoma. On the one hand, it is imperative that rural communities are part of the conversation. As Vilsack said in a talk with NPR,

[I]f you take a look at the persistently poor counties in the United States, there’s 703 of them. And of the 703, 571 persistently poor counties are rural in nature. So it is very much a rural issue (Vilsack, 2014)[.]

However, similar to programs like Race to the Top, the Obama administration’s neoliberal competitive grant approach does little to actually intervene and support rural communities. Except for a group of AmeriCorps volunteers, promise zone counties receive little on-the-ground support. Rural communities are suffering in an economic way, absolutely, but this money needs to go towards supporting actual revitalization and more attractive work for returning college graduates.

  • The rural achievement gap is an opportunity gap, not an attainment gap.

As I have explored above, attainment is not the problem. Access, on the other hand, is. Once in degree programs, rural students complete them at or above the rates that urban students do, but an enormous number of factors, from socioeconomic status to expectations to the logistics of travel, reinforce the barrier.

One method to alleviate this gap could be the strengthening of community college opportunities to serve students that might not otherwise attend college. With more than a quarter of rural degree-holders seeking 2-year degrees, community colleges that provide access and affordability (and even a bridge to a 4-year degree) could provide an essential institution for training and retaining rural high school graduates. Rural students seeking 2-year degrees often face similarly daunting barriers to obtaining their degree, including “(a) overall unfamiliarity with college; (b) low education levels; (c) financial insecurity; (d) family responsibilities; and (e) distance, inadequate transportation, and housing,” (Nikolay, 2011). With more affordable community college opportunities and more support systems within those community colleges, rural students may consider opportunities they might not have otherwise.

Another is the incorporation of stronger “distance learning” programs in the absence of trained faculty and resources to support strong AP or other advanced level curriculum. In a study done on rural distance learning (Hannum, Irvin, Banks, & Farmer, 2009), most rural schools had implemented some form of distance learning and were mostly satisfied with it, but two thirds of those schools indicated a need for additional course offerings. Especially in situations in which education deserts act as a barrier, students that are capable of pursuing resources outside of the scope of what is offered by the school should have those options made available to them. These resources could also expand to include stronger online degree programs for rural students who struggle logistically to access an actual college campus after graduation.

  • Strengthening rural school environments strengthens rural community environments.

In the same way that students from impoverished inner-city schools may view their enrollment in college as an “escape,” rural students that overcome the odds and pursue college further than 50 miles from their homes may feel a similar way. Students that “escape” are not students that are likely to return.

The existing bond between rural schools and rural communities may well be the greatest asset to raising student (and adult) expectations of success and could tie students more positively to the communities they leave behind. Bruce Miller’s 1995 paper “The Role of Rural Schools in Community Development” lays out an array of tangible ideas for implementing revitalization policy. Many of these ideas place students at the forefront of infrastructure projects in their communities, building guided task-forces to tackle issues in their communities that affect them every day, like creating areas for public recreation or working with the local Forest Service. These opportunities seek to connect students with adults in their community and build a sense of shared responsibility and respect for the place that they live (Miller, 1995). Although the current federal administration may quell optimism about the continuance of any kind of rural grant project, this is the kind of resource allocation that can build on a community’s strengths and provide real healing.

Conclusions and Limitations

Due simply to the limited scope of this paper, both my analyses and my recommendations run into significant limitations. Given more time and more expertise with data management, the NLSY data provides much more explicit geographic characterization options than solely “rural” or “urban.” There even exists data on migration patterns for each student in the survey that could provide a much more nuanced view of where and when the NLSY97 cohort is moving.  In addition, there are many more angles to be explored in the decision-making process of rural students than simply expectations. As mentioned above, stratifications based on race, class, and gender, would all be relevant avenues of exploration, as well as more in-depth investigation of rural school and community culture. Further, my policy recommendations are more guidelines, or ways of thinking about solutions, rather than specific strategies for policy implementation. Solutions must provide tangible logistical improvements for rural students seeking higher education. We can not talk about what is best for rural students without talking to rural students.

As with any problem in education, there is no easy cure-all. Rural access to higher education presents a peculiar case in that encouraging access can also further hurt already suffering communities by inciting talented students to leave. That is why any policy solution must be twofold; it must both empower rural students to feel confident in their abilities to succeed at the next level, and must encourage them to be stakeholders in the rural communities that they come from. Any comprehensive policy solution must first treat rural students as rational decision-makers facing tough choices, rather than writing off these students as inherently unprepared for an urbanized, industrialized future.

[Word Count: 3945]

Works Cited

Bureau of Labor Statistics. (1997 – 2014). National Longitudinal Survey of Youth 1997. National Longitudinal Surveys . Washington, D.C., USA: Bureau of Labor Statistics.

Cramer, K. (2016, August 18). Is ‘Rural Resentment’ Driving Voters To Donald Trump? NPR. (D. Kurtzleben, Interviewer)

Cromartie, J. (2013). How is Rural America Changing? United States Department of Agriculture, Economic Research Service. C-SPAN.

Gibbs, R. (1998). College Completion and Return Migration Among Rural Youth. In R. M.

Gibbs, P. L. Swain, & R. Teixeira (Eds.), Rural Education and Training in the New Economy: The Myth of the Rural Skills Gap (pp. 61-81). Ames, Iowa, USA: Iowa State University Press.

Gibbs, R. (2005). Education as a Rural Development Strategy. Amber Waves , 3 (5).

Glasmeier, A., & Salant, P. (2006). Low-Skill Workers in Rural America Face Permanent Job Loss . Carsey Institute. University of New Hampshire.

Hannum, W. H., Irvin, M. J., Banks, B. J., & Farmer, T. W. (2009). Distance Education Use in Rural Schools. Journal of Research in Rural Education , 24 (3), 1-15.

Herzog, M. J., & Pittman, R. B. (1995). Home, Family, and Community: Ingredients in the Rural Education Equation. Western Carolina University, Department of Administration, Curriculum and Instruction.

Hillman, N., & Weichman, T. (2016). Education Deserts: The Continued Significance of “Place”  in the Twenty-First Century. American Council on Education. Washington, DC: Center for Policy Research and Strategy.

Jordan, J. L., Kostandini, G., & Mykerezi, E. (2012). Rural and Urban High School Dropout Rates: Are They Different? Journal of Research in Rural Education , 27 (12).

Miller, B. A. (1995). The Role of Rural Schools in Community Development: Policy Issues and Implications. Journal of Research in Rural Education , 11 (3), 163-172.

Monk, D. H. (2007). Recruiting and Retaining High-Quality Teachers in Rural Areas. The Future of Children , 17 (1), 155-174.

Nikolay, C. (2011)Non-Traditional Students and Rural Community Colleges. Oregon State University.

Pappano, L. (2017, January 31). Colleges Discover the Rural Student. The New York Times .

Pappano, L. (2017, January 31). Voices From Rural America on Why (or Why Not) to Go to College. The New York Times .

Reeves, F. W. (1945). Emerging Problems in Rural Education. In F. W. Reeves (Ed.), Education for Rural America (pp. 9-22). Chicago, Illinois, USA: University of Chicago Press.

Robbins, B. M. (2012). “People Like Us Don’t Go There”: Local Culture and College Aspirations in Rural Nebraska. Yale Journal of Sociology .

Silver, N. (2016, November 22). Education, Not Income, Predicted Who Would Vote For Trump. FiveThirtyEight .

Tieken, M. C. (2014). Why Rural Schools Matter. The University of North Carolina Press Chapel Hill.

United States Census Bureau. (2010). Urban and Rural. Retrieved April 26, 2017, from United States Census Bureau: https://www.census.gov/geo/reference/urban-rural.html

Vilsack, T. (2014, January 15). U.S. Agriculture Secretary ‘Convinced’ Rural Revitalization Plan Will Work Facebook. NPR. (M. Martin, Interviewer)

AP Enrollment and Equity in New Haven Public High Schools

Executive Summary

This report explores access to and participation in the AP program, which has been shown to have benefits in the college application and matriculation process, in New Haven’s public high schools. Using AP enrollment data from the Office for Civil Rights, the report finds that the AP programs throughout New Haven are underutilized and that white students are disproportionately over-represented in AP programs in each of the city’s interdistrict magnet high schools.

Introduction

Students who participate in Advanced Placement (AP) coursework and testing are more likely to experience better outcomes in the college application process and in college performance. Across the nation, however, the students who reap the benefits from AP programs are disproportionately white, while black and Hispanic students are overwhelmingly underrepresented in AP participation. There are many factors that contribute to this reality, including self-segregation and ability tracking that occurs within schools, as well inequitable applications of the AP programs in schools that are comprised predominantly of students of color.

This report examines the breadth of AP programming in public high schools in New Haven, CT. In particular, it focuses on the enrollment of minority students in AP programs in New Haven’s interdistrict magnet high schools, which are designed in-part to increase academic achievement for students of color. Some aspects of the interdistrict magnets, such as their overall racial compositions, have been studied by agencies like Connecticut Voices for Children, but there has yet to be a study of the AP programs within these schools and how the AP programs affect minority students.

This report begins with background on the development of the AP program, the use of AP across New Haven public schools (NHPS), and reviews prior research on AP participation rates for students of color. It then utilizes AP enrollment data provided by the Office for Civil Rights to compare participation and performance in AP coursework and exams for black, Hispanic, and white students.[1] The report finds that the AP programs throughout New Haven are highly underutilized and that white students are disproportionately overrepresented in AP programs in each of the interdistrict magnet high schools. Ultimately, the report recommends a citywide initiative to encourage participation and engagement in the AP classes offered at each school, as well as an expansion of AP programs at interdistrict magnet schools that offer a maximum of three AP courses.

Background

The Advanced Placement Program 

Advanced Placement coursework and testing plays a large role in the high school experiences and college application processes of many students across the United States and across the world. Founded in the mid-20th century, the Advanced Placement program was developed to provide college level curricula and test standards that could be implemented at a high school level to better prepare students for the rigors of postsecondary education.[2] Since the 1950s, the program has expanded substantially. In 2016, 2,611,172 students took a total of 4,704,980 AP exams, in contrast with the 1,229 students that took 2,199 exams in 1956.[3] In 2013, 33.2% of US public high school graduates took at least one AP exam, an increase of almost 15% since 2003.[4]

The increased prevalence of AP coursework and testing has impacted how students prepare for and perform in college and university settings.  Many universities value the presence of AP or International Baccalaureate (IB) coursework on a student’s transcript and may ask the student to provide their AP test scores on their university application.[5] With college preparatory curricula, AP coursework on a student’s transcript shows that they are willing to challenge themselves with a difficult course load, and test scores between 3, 4, and 5, where 3 is passing and 5 is the highest score possible, demonstrate a mastery of the high level material. At some universities, a score between 3 and 5 on an AP exam can translate directly into college credit for a student, allowing them to take more advanced classes or take less coursework overall during their time in college.

Over the last twenty years, a number of studies have been conducted to measure the effects of AP enrollment and test performance on college graduation and performance rates. For example, one 2009 study conducted by CollegeBoard, the company that administers AP, illustrated that higher performance on the AP English Language, Biology, Calculus AB, and US History exams resulted in higher first-year GPA’s in college, higher second year retention rates, and acceptance to more selective institutions, as compared to students who scored poorly on these AP exams or did not take the exams at all. Students who scored poorly on the AP exams still had better college outcomes than those who did not take the exams.[6]

Unfortunately, the benefits of AP course enrollment and exam performance are not extended equally across students of all races, ethnicities, and socioeconomic statuses. According to a 2008 report from the Educational Testing Service, only 81% of black students attend public schools where at least one student is taking an AP exam, compared to 88% of Hispanic, 86% of white, and 94% of Asian students.[7] Black students are also more likely than students of all other ethnicities to attend high schools with less than three total AP courses in math, science, and English language. Low income students are less likely than high income students to attend a school where at least one person is taking an AP exam and are more likely to attend schools with limited AP options.[8] Even school does have AP options, this does not mean that a majority of students within that school participate in these courses. According to the same study, half of schools that offer AP courses experience less than 5% participation in the program. Furthermore, black, Hispanic, and low-income students are less likely to participate in AP exams than white, Asian, and high-income students, even when black, Hispanic, and low-income students are a majority within their own schools.[9]

There are many factors that contribute to why black, Hispanic, and low-income students have historically lower participation and performance in AP courses and exams than white, Asian, and high-income students. One factor is that the latter groups of students may have parents with higher levels of education and knowledge of the importance of AP coursework in the college application process. These parents might in turn encourage their children to take high level AP coursework and may also be able to afford to live in school districts with high schools that have extensive AP offerings and histories of excellent AP performance.

Some places across the US have attempted to mitigate these inequities in access and participation by ensuring that AP coursework is available and encouraged in all public schools in the district. In 2016, for example, New York Mayor de Blasio initiated “AP for All”, a push to bring AP courses to thirty-five public schools that had no AP classes in the 2015-2016 school year. De Blasio aims to ensure that 75% of New York’s public school students have access to at least five AP classes by 2018 and that all students will have access to at least one AP class by 2021. He hopes that increasing access to AP courses will also increase participation among students who have had historically low participation rates but could succeed within and benefit from an AP program.[10]

The AP Program in New Haven

Given the ongoing racial and socioeconomic inequities that have been documented in access to AP classes and exams, AP participation, and AP performance, these three categories serve as excellent metrics for measuring racial and ethnic inequalities within a particular school system. Do students of color have access to AP coursework within their available public schools? Does AP enrollment in a particular school reflect the proportion of students of color enrolled in that school? Are students of color passing their AP exams at the same rates as their white peers? These questions and the metrics of access, participation, and performance are particularly salient in considering the public school system in New Haven, CT.

Since the mid-1990s, New Haven has embarked on a voluntary desegregation initiative that is intended to increase rates of racial diversity within its public schools and improve academic outcomes for students of color, particularly those who are black or Hispanic. A major element of this process has been the creation of interdistrict magnet schools, which are designed to facilitate racial and ethnic integration by attracting white families from neighboring suburbs and to provide well-resourced facilities and curricula for New Haven students.[11] Since the beginning of the interdistrict magnet program in 1995, New Haven’s entire public school system has been converted into a system of choice. New Haven residents participate in the School Choice Placement Process, essentially a lottery system that distributes incoming students throughout the city’s neighborhood, magnet, interdistrict magnet, and charter schools. Suburban residents can also join the lottery for places in the interdistrict magnet schools, which reserve a certain number of seats for suburban residents to help facilitate racial and socioeconomic integration[12].

Maintaining a consistent and competitive AP program within the interdistrict magnet schools is a challenge compared to New Haven’s two comprehensive high schools.  Wilbur Cross and James Hillhouse, the two comprehensive schools, serve over 1400 and over 900 students, respectively, and both schools offer over ten AP courses. In contrast, each of the seven interdistrict magnet high schools is relatively small, with the largest serving 688 students in 2013. There is no consistency in the number of AP classes offered across the schools; in 2013, each interdistrict magnet high school offered between two and fourteen AP classes. The two largest schools, Hill Regional Career (HRC) and Cooperative Arts and Humanities (COOP), were the only two interdistrict magnets to offer ten or more AP classes.[13]

Having a multitude of AP courses in every neighborhood and interdistrict magnet school is good for the district—it provides opportunities for rigorous coursework to all New Haven residents and is likely a major attractor for white and affluent suburban residents who may consider sending their children to the interdistrict magnets. However, extensive AP programs are difficult to maintain and grow in schools with a smaller population and a sporadic history of AP participation in the classes that are offered. These competing motivations for the district may help to explain the lack of consistency in the size of AP offerings across the city.

Recent enrollment data suggests that twenty years after the start of New Haven’s interdistrict magnet program, only one of the city’s interdistrict magnet high schools, ESUMS, is currently meeting the city’s objectives of creating racially diverse schools with a minimum of 25% white enrollment.[14] What basic enrollment data cannot reveal, however, is whether or not ESUMS, or any of the other New Haven interdistrict magnet schools, are experiencing racial integration and offering advanced academic opportunities to students of color within the schools. Rather, AP enrollment data provided by the national Office for Civil Rights, which is disaggregated by race, gives some insight into what is going on within a school. The next section of this paper uses these data to compare access to, participation in, and performance on AP coursework and examinations between New Haven’s seven interdistrict magnet high schools and its two comprehensive high schools. In particular, the report seeks to determine whether the demographic of students enrolled in AP coursework in the magnet schools is more reflective of the school’s overall racial demographic than the AP courses offered at the comprehensive high schools.

Evidence

Access to the AP Program

AP classes are available to students within most of New Haven’s public high schools; nine of ten high schools offer two or more AP classes. The one school which does not, Riverside Education Academy, currently operates as a magnet school for New Haven residents and is geared towards students who need additional behavioral support.[15] The New Haven Public School system, College Board, and the state of Connecticut cover the full cost of the AP exams for all students, so there is no explicit financial barrier to taking AP classes or exams. The NHPS website advertises that “every college-bound junior and senior” should be involved in the city’s AP program and relays the potential benefits of taking AP courses for student growth and the college application process.[16]

However, the number of AP courses available varies greatly among the nine high schools, ranging from two at Cortland V.R. Creed (formerly the Hyde Leadership School) to fourteen at the Cooperative Arts and Humanities High School (COOP) in 2013.[17] With this large variation in courses offered across the city, there is also a large variation in student participation in AP coursework from school to school. COOP and Hill Regional Career (HRC), for example, offer the most AP courses among the interdistrict magnets, with approximately 25% of the student body taking AP classes in both schools. In contrast, Cortland V.R. Creed, which offers the lowest number of AP classes, has a much lower percentage of student participation, at 12.9%. The differences in course offerings and in student participation suggest that at the interdistrict magnet schools with more AP courses, students are more likely to participate in AP coursework and AP examinations.

Within New Haven’s system of school choice, the disparity in access to AP coursework could prove to be a source of inequity for New Haven residents and a factor that could discourage suburban families from enrolling in the city’s interdistrict magnets. Students from New Haven, who are more likely to be people of color and low-income, can apply to enroll in both neighborhood and interdistrict magnet high schools.[18] However, given the high levels of interest in the interdistrict magnets, there is no guarantee that New Haven residents will be able to enroll their children in any of their schools of choice, and students may in turn be shuffled into the two neighborhood schools or other magnets that are under-enrolled in a particular year rather than receiving a spot at an interdistrict magnet. Although the two neighborhood schools, Wilbur Cross and James Hillhouse, both offer ten or more AP courses, they provide very different learning environments than the interdistrict magnets, which have a much smaller student body and specialized curricula and resources. So, if a New Haven resident wants a high school with the benefits of a small, specialized program and an excellent AP program, they have to win the lottery and receive a spot at COOP or HRC, which are two of the most highly sought after high schools in the city.[19] Otherwise, the student risks being enrolled in a magnet school with limited AP options or a neighborhood school that has many AP options but a student body between 900 and 1500 students and low rates of AP participation.

For more affluent suburban families, a large number of AP courses and a school culture that values AP coursework may be a huge draw; in addition to attending a diverse magnet school, their children will be better prepared for college matriculation and the college application process. However, only two of the interdistrict magnet schools offer more than ten AP options, whereas the other five schools offer five or less. The two neighborhood schools both offer ten or more AP options, but suburban families cannot apply to these schools because they are not a part of the interdistrict network. Given the uncertainty associated with the School Placement Process- families may not receive any of their top schools of choice- suburban families risk being placed in an interdistrict magnet school with a very limited number of AP options, which in turn may deter them from applying or enrolling in NHPS at all. Whether or not the variation in AP offerings affects the decision of suburban residents to participate in the New Haven School Choice Placement Process has yet to be studied and could be an important topic for further ethnographic research. However, the logic of the school placement process suggests that it may be beneficial for each of the interdistrict magnet schools to develop AP programs that are competitive with COOP, HRC, Wilbur Cross, and Hillhouse. This could attract more suburban families and also ensure that every New Haven resident has equitable access to the benefits of AP regardless of where they are placed.

Participation in AP programs within NHPS

The analysis in the previous section highlights a wide variation in the availability of the AP program across New Haven’s public high schools. This variation may disproportionately affect New Haven residents and act as a deterrent in the city’s wider push to facilitate racial and socioeconomic integration. But, how does the AP program function within the nine schools within which it is available? Are students of color participating in the AP coursework that is offered, and are they performing at the same level as their white peers? This next section of analysis utilizes AP enrollment data from the national Office for Civil Rights in 2013 to shed light on these questions.

District-wide, student participation in the AP program was extremely low in 2013. Only 14.5 of all students in New Haven high schools with AP classes were taking at least one AP class, and, as Figure 1 indicates, the number of white students taking AP courses in New Haven was disproportionately high compared to the number of white students enrolled in the district. Furthermore, the percentage of students passing the AP exams was disproportionately white compared to the number of white students enrolled in the district and those who took AP courses. Black and Hispanic students were underrepresented in the population enrolled in AP classes, and a much smaller percentage of black students passed the AP exams than were enrolled in AP courses. On a district-wide scale, these data suggest that the AP program offered in New Haven is hugely underutilized, with an incredibly small percentage of students enrolled. White students are overrepresented in the populations of students participating in and passing AP coursework and exams, while black and Hispanic students are underrepresented.

Figure 1: Enrollment data from the Office for Civil Rights
Figure 2: Enrollment data from the Office for Civil Rights

As illustrated by Figure 2, participation in AP coursework is highly varied across both the comprehensive and interdistrict magnets school, and it seems like there could be a relationship between the status as an interdistrict magnet school, the number of AP classes offered, and higher rates of AP participation. At COOP and HRC, which offered 14 and 12 AP courses, respectively, rates of participation were above 20% of the student body. In comparison, the two comprehensive high schools, Wilbur Cross and James Hillhouse, which offered 12 and 10 AP classes, respectively, had participation rates just below or above 10%. Four of the remaining interdistrict magnet schools, which each offered less than six AP courses, experienced comparable participation rates to the comprehensive schools in spite of their limited course offerings. The data suggest that status as an interdistrict magnet school could foster higher rates of participation in AP coursework, especially when larger numbers of AP classes are offered.  To confirm this connection, it would be helpful to study trends in AP participation as the number of AP courses offered at each school has changed, and in many cases, increased, over time.

Looking within each of the schools in 2013, black students were consistently underrepresented in the schools’ AP programs compared with their overall enrollment in each school. Only three of the seven interdistrict magnet schools (COOP, HSC, and Corlandt V.R. Creed) enrolled black students in AP courses at a rate that is relatively close to (within approximately ten percentage points of) the schools’ overall enrollment of black students. At the remaining four interdistrict magnets, white students were disproportionately overrepresented in the AP courses, which means that although white students only comprised a small portion of the school’s population, they comprised a substantial portion of those taking AP classes. Of the two comprehensive high schools, only James Hillhouse, which enrolled less than 3% white students, enrolled black students in AP classes at a similar rate to their overall enrollment. Hispanic students are more proportionately represented in the AP classes in most of the schools. Their AP enrollment falls within ten percent of the schools’ overall Hispanic enrollment at Hillhouse, and at six of seven interdistrict magnets. This reflects research trends that show higher participation in AP classes across the country for Hispanic students, but could also be a result of external factors, such as the recent increase in Hispanic residents living in New Haven and its surrounding suburbs.[20]

Most of the schools did not have data available about the rates at which students passed their AP exams, and thus it is not possible to compare the rates at which students of color are passing their AP exams compared to their enrollment in AP classes. At the two interdistrict magnets that do provide this data, COOP and HRC, the percentage of black students passing their AP exams was substantially lower than the number of black students enrolled in AP classes, while the percentage of white students was higher. Hispanic students passed their AP exams at a higher rate than they were enrolled in the AP classes.

These data indicate that neither status as an interdistrict magnet school nor as a traditional comprehensive high schools means that black students are accessing the AP coursework and exams available at same rates as their white and Hispanic peers. While this is not surprising, given previous research that has revealed similar trends, it is noteworthy given the fact that the interdistrict magnet schools are designed to promote academic performance for students of color and provide equitable opportunities to students of all races and ethnicities. There are many reasons why these disparities could exist from school to school: many of the schools allow students into their AP programs on the basis of a teacher recommendation, which could depend on a student’s previous behavior or GPA. The disparity in access to AP programs across the interdistrict magnets could also play a role; the interdistrict schools with limited numbers of AP classes may have less of a school culture of taking AP, and thus engage less of the students in these predominantly black and Hispanic schools.

Conclusion 

This report has highlighted the benefits of AP enrollment and completion and used AP enrollment data to demonstrate that these benefits are not being accessed equitably by all students in New Haven’s public high schools. Black students are less likely than white and Hispanic students to enroll in the AP courses offered at their schools, and all students that are New Haven residents risk uncertainty in the school choice lottery which could place them in a school with an excellent AP program, or one with only two course offerings. Furthermore, AP coursework is highly underutilized in NHPS, with only 14.5% of all New Haven high school students in the nine schools with the AP program taking at least one AP class. As a district that is trying to increase academic achievement for all students and particularly those of color, there must be a greater effort to engage all high school students in taking AP coursework, or in other advanced programs, such as the IB program, which are not currently offered by NHPS but that have similar benefits for college admittance and persistence. This could be accomplished by providing district wide incentives, for example, scholarship money, to students participating in AP coursework. Schools could also be encouraged to make participation in at least one AP class a requirement for graduation.  Furthermore, the AP programs at schools with less than four AP classes should be expanded so that they are competitive with other New Haven high schools that have five or more AP classes. This will provide a more equal opportunity for students to reap the benefits of AP classes even if they are not placed in a magnet school with a flourishing AP program and will provide an incentive for more suburban families to apply to New Haven schools if there is a wealth of excellent options to choose from.

Acknowledgments

Thank you to fellow student Clare Carroll for reading and editing a draft of this paper for me. Many thanks also to Dr. Mira Debs for providing insight and guidance into this research topic, and for teaching me the research tools needed to find and work with enrollment data.

End Notes

[1] Asian students are excluded from this discussion because there are not enough Asian students enrolled in most of the interdistrict magnet high schools for relevant data findings and comparisons.

[2] “A Brief History of the Advanced Placement Program,” The College Board, 2003, http://www.collegeboard.com/prod_downloads/about/news_info/ap/ap_history_english.pdf.

[3] “Annual AP Program Participation 1956-2016,” The College Board, 2016, https://secure-media.collegeboard.org/digitalServices/pdf/research/2016/2016-Annual-Participation.pdf.

[4] “10 Years of Advanced Placement Exam Data Show Significant Gains in Access and Success; Areas for Improvement,” The College Board, 2014, https://www.collegeboard.org/releases/2014/class-2013-advanced-placement-results-announced.

[5] Daniel Gilbert Solorzano and Armida Ornelas, “A critical race analysis of Latina/o and African American advanced placement enrollment in public high schools,” The High School Journal 87, no. 3, 2004, 16.

[6] Krista D. Mattern, Emily J. Shaw, and Xinhui Xiong, “The Relationship between AP Exam Performance and College Outcomes,” The College Board, 2009, https://research.collegeboard.org/sites/default/files/publications/2012/7/researchreport-2009-4-relationship-between-ap-exam-performance-college-outcomes.pdf, 12.

[7] Phillip Handwerk, Namrata Tognatta, Richard J. Coley, and Drew H. Gitomer, “Access to Success: Patterns of Advanced Placement Participation in U.S. High Schools,” Educational Testing Service, 2008, https://www.ets.org/Media/Research/pdf/PIC-ACCESS.pdf, 16.

[8] Ibid, 3-4.

[9] Ibid, 19.

[10] Ben Chapman, “EXCLUSIVE: De Blasio’s ‘AP for All” push will offer city high schools new Advanced Placement courses,” Daily News, 2016, http://www.nydailynews.com/new-york/education/ap-push-offer-city-high-schools-new-ap-courses-article-1.2670164.

[11] “An Act Concerning School Choice and Interdistrict Programs,” The Committee on Appropriations , By William R. Dyson, Connecticut General Assembly Cong, 6950, January 1999, https://www.cga.ct.gov/ps99/fc/1999HB-06950-R000694-FC.htm.

[12] Brian Zahn, “Parents learn Wednesday if child got into school of choice in New Haven,” New Haven Register, 2017, http://www.nhregister.com/social-affairs/20170404/parents-learn-wednesday-if-child-got-into-school-of-choice-in-new-haven.

[13] Data from the Office for Civil Rights.

[14] Data from the National Center for Education Statistics.

[15] “Transitional Schools,” New Haven Public Schools, http://www.nhps.net/node/419.

[16] “Advanced Placement Program in New Haven Public Schools,” New Haven Public Schools, http://www.nhps.net/node/2643.

[17] Office for Civil Rights. The number of AP courses taught at each school has changed since 2013 in some cases; however, because the most recent full data set from the OCR is from 2013, all references to AP coursework refer to data from 2013.

[18] “New Haven Demographics Profile,” areavibes, 2017, http://www.areavibes.com/new+haven-ct/demographics/.

[19] “Last Year’s (2016-2017) Applicants and Placements & Projected Seats for School Year 2017-2018,” New Haven Public Schools of Choice, 2017, http://newhavenmagnetschools.com/images/2017-Applicants-Placements-Data.pdf.

[20] “More Latinos, Fewer Whites and Blacks,” New Haven Independent, 2011, http://www.newhavenindependent.org/index.php/archives/entry/more_latinos_fewer_whites_and_blacks/;  Phillip Handwerk, et. al, “Access to Success,” 18.

Works Cited

“A Brief History of the Advanced Placement Program.” The College Board. (2003.) http://www.collegeboard.com/prod_downloads/about/news_info/ap/ap_history_english.pdf.

“Advanced Placement Program in New Haven Public Schools.” New Haven Public Schools. http://www.nhps.net/node/2643.

“An Act Concerning School Choice and Interdistrict Programs.” The Committee on Appropriations. By William R. Dyson. Connecticut General Assembly Cong, 6950. (1999.) https://www.cga.ct.gov/ps99/fc/1999HB-06950-R000694-FC.htm.

“Annual AP Program Participation 1956-2016.” The College Board. (2016.) https://secure-media.collegeboard.org/digitalServices/pdf/research/2016/2016-Annual-Participation.pdf.

Chapman, Ben. “EXCLUSIVE: De Blasio’s ‘AP for All” push will offer city high schools new Advanced Placement courses.” Daily News. (2016.) http://www.nydailynews.com/new-york/education/ap-push-offer-city-high-schools-new-ap-courses-article-1.2670164.

Handwerk, Phillip, Namrata Tognatta, Richard J. Coley, and Drew H. Gitomer. “Access to Success: Patterns of Advanced Placement Participation in U.S. High Schools.” Educational Testing Service. (2008) https://www.ets.org/Media/Research/pdf/PIC-ACCESS.pdf.

“Last Year’s (2016-2017) Applicants and Placements & Projected Seats for School Year 2017-2018.” New Haven Public Schools of Choice. (2017.) http://newhavenmagnetschools.com/images/2017-Applicants-Placements-Data.pdf.

Mattern, Krista D., Emily J. Shaw, and Xinhui Xiong. “The Relationship between AP Exam Performance and College Outcomes.” The College Board. (2009.) https://research.collegeboard.org/sites/default/files/publications/2012/7/researchreport-2009-4-relationship-between-ap-exam-performance-college-outcomes.pdf.

“More Latinos, Fewer Whites and Blacks.” New Haven Independent. 2011. http://www.newhavenindependent.org/index.php/archives/entry/more_latinos_fewer_whites_and_blacks/.

National Center for Education Statistics.

“New Haven Demographics Profile.” Areavibes. (2017.) http://www.areavibes.com/new+haven-ct/demographics/.

Office for Civil Rights.

Solorzano, Daniel Gilbert, and Armida Ornelas. “A critical race analysis of Latina/o and African American advanced placement enrollment in public high schools.” The High School Journal 87, no. 3 (2004): 15-26.

“Transitional Schools.” New Haven Public Schools. http://www.nhps.net/node/419.

Zahn, Brian. “Parents learn Wednesday if child got into school of choice in New Haven.” New Haven Register. (2017.) http://www.nhregister.com/social-affairs/20170404/parents-learn-wednesday-if-child-got-into-school-of-choice-in-new-haven.

“10 Years of Advanced Placement Exam Data Show Significant Gains in Access and Success; Areas for Improvement.” The College Board. (2014.) https://www.collegeboard.org/releases/2014/class-2013-advanced-placement-results-announced.

Rezoning NYC Public Schools: Parents of Color Resistance to Rezoning As a Means of Integration

Executive Summary

The rezoning of PS 191 and PS 199 in Manhattan and PS 307 and PS 8 in Brooklyn were the two most contentious battles in the city’s fight towards integration and desegregation of public schools. While other research has examined the positive aspects of integration in schools through gentrification, this policy memo delineates the reasons for which parents of color were resistant to rezoning their schools in the face of this gentrification and a growing support for integration as a means to solve issues of funding, resources, and segregation in New York City.

Introduction

The ruling that separate black and white schools were inherently unequal in Brown v. Board of Education was an incredible feat for black Americans in 1954. It openly acknowledged the way in which unequal resources and institutions negatively affected black students. As a result, desegregation and integration policies were mandated by the Supreme Court in order to create an equal and fair education for black Americans and other minorities in the United States (Wells et. al. 2016). Nevertheless, Brown’s ruling has yet to be fulfilled 63 years later and schools are actually more segregated now than in the 1960s (Orfield and Lee 2007).

Schools are often reflections of the racial and socioeconomic demographics in neighborhoods (NY Appleseed 2013). Some New York City neighborhoods are currently undergoing dramatic demographic shifts as white middle and upper-class families move back into the city, essentially a reversal of the white flight that occurred in the early 1950s in an attempt to escape the growing populations of African Americans in the cities (Burns Stillman 2012). The gentrification of New York neighborhoods is lauded as an opportunity for integration within the public schools, which are among the most segregated in the country (Kucsera and Orfield 2014). However, the socioeconomic and racial differences between families are coming to a head in the classroom as demographics of the schools begin to change along with the neighborhoods. New York City has proposed to rezone schools as a way to accommodate the incoming white population and facilitate integration with the existing population of predominantly black and Latino families (Posey-Maddox 2014). Nevertheless, low-income parents of color are resistant to rezoning their schools. This report will delineate the reasons for this resistance as well as the ways in which integration can have a negative impact on the perception, resources and culture of a school.

Background

In the 2010-2011 school year, 64% of black students and 58% of Latino students were enrolled in schools with 10% or less white student enrollment. According to the report released by UCLA on New York public school segregation, “the extreme share of black students enrolled in intensely segregated schools have steadily increased.” This report further explores this phenomenon in terms of minority student exposure to white students and found that it has been declining over time as the white student population decreases in public schools. Additionally, as black and Latino students continue to be disproportionately enrolled in schools that are racially isolated, they are also more likely to attend schools that are disproportionately low-income students. As a result, they experience what the report calls as “double segregation” by attending schools that are segregated by race and class (Kucsera and Orfield 2014). On the other hand, white students are increasingly isolated in public schools. White students are enrolled in schools that are heavily white and their exposure to low-income students is much lower compared to that of their black peers, 29.1% and 69.2% respectively.

Racial and socioeconomic segregation in public schools are detrimental to the achievement of black students. In 2003, “40 percent of black 4th graders scored at or above the ‘basic’ level in reading, compared with 75 percent of white students” on the National Assessment of Educational Progress (Fuller 2004). Black students in segregated schools are also “less likely to have experienced teachers, advanced courses, instructional materials, and adequate facilities” (Hannah-Jones 2016). This disparity in resources and achievement also translates to longer term consequences for black students once they are outside the education system, such as differences in well-being and household incomes (Fuller 2004).

Alternatively, black students improved significantly on their reading and math test scores when they were enrolled in integrated, middle-class schools. The achievement gap between them and white students “closed more rapidly during the peak years of school desegregation” than any other time in education policy (Wells et al. 2016). This improvement in test scores is attributed to the fact that racial and socioeconomic integration creates more equitable access to experienced teachers, good facilities, more challenging curriculum, and more funding for students (Wells et al. 2016). Additionally, some studies show that “the higher educational aspirations” of middle-class families have a positive influence on student achievement (Kahlenberg 2001).

School attendance zones are an example of a system that perpetuates racial and socioeconomic inequality because of the reciprocal relationship between housing and school segregation. Yet, zones range in size and do not necessarily reflect only one neighborhood demographic (New York Appleseed 2013). They can encompass a couple of blocks or literally the entire Upper West Side of Manhattan and Harlem (see map below) (Taylor Jan. 2016). As a result, redrawing zone lines could allow for more students of different racial and socio economic backgrounds to be included and create the possibility of integration (Saporito and Van Riper 2015).  

The Battlegrounds for Integration:

“Through the veil I could perceive the forbidden city, the Louisville where white folks lived. It was the Louisville of downtown hotels, the lower floors of the big movie houses, the high schools I read about in the daily newspapers… On my side of the veil everything was black: the homes, the people, the churches, the schools… I knew that there were two Louisvilles and in America, two Americas. I knew, also, which of the Americas was mine.”

– Blyden Jackson in The Waiting Years

In this excerpt, Blyden Jackson is describing his experience as a black male in the Jim Crow South, and yet, his analogy of the two sides of the veil and two Americas also depicts the current segregation in New York City schools. On one side of the neighborhood are PS 8 and PS 199, two schools in Brooklyn and Manhattan respectively, that are well-funded and serve predominantly white student populations (Taylor 2016; Taylor, Sept. 2015). On the other side of the neighborhood are PS 307 and PS 191, which serve low-income predominantly black and Latino students. Although they may only be a few blocks away or less than a mile from each other, the perception, resources, and culture of these pairs of schools are incredibly different, reflecting the idea of “two Americas”.

New York city district administrators, therefore, now face the challenge of drawing and redrawing school zones as they try to find a balance between this intense segregation in these schools, the influx of white middle and upper-class families as gentrifiers, and the low-income minority families already in the neighborhood. Ultimately, the question is who will be included and excluded by these invisible boundaries. The most contentious attempts to redraw school zones are played out in the zones that contain PS 199 and PS 191 in Manhattan and PS 307 and PS 8 in Brooklyn. These schools were battlegrounds of integration since parents were split along race and class lines as they argue about the rezoning of their respective schools. The following section will describe the responses of parents of color to these rezoning proposals while also identifying the greater dynamics between integration, gentrification, and segregation that are at play and ultimately affect any school that wishes to integrate.

Mobility and Choice

Location determines a family’s access to resources like food, community centers, transportation, and schools and their quality as well. Because students are zoned to schools based on their address, school quality and composition are aspects that families evaluate as they try to find a place to settle. However, this mobility and choice is a privilege because it is only available to and practiced by those who have the means and ability to do so.

In her New York Times article, The Get-Into-School Card, Higgins writes, “moving to a particular neighborhood in order to land a seat at a covered public schools has long been the middle-class operandi for obtaining a high-quality education in New York” (Higgins 2013). We can see this practice being carried out by white middle and upper-middle class families who are gentrifying neighborhoods throughout Brooklyn and Manhattan. For many of these, “good” public schools are usually evaluated by their test scores and student proficiency (Posey-Maddox 2016).

It is obvious why PS 8’s student achievement and test scores are cited as main attractions for incoming families. Its proficiency percentage is double that of the student proficiency in PS 307 for 4 consecutive school years and higher than city average (NYSED Data). Nevertheless, an important thing to note is that the student test scores in PS 307 “ are closer to the average for black and Hispanic students” (Taylor, Sept. 2015), which is an important fact to acknowledge because it demonstrates a different type of achievement and success that is not usually recognized. Nevertheless, white parents from PS 8 who were rezoned to PS 307 continue to express their concerns in regards to the “low test scores” of the latter (Taylor, Sept. 2015). This anger and concern about rezoning stems from the fact that parents specifically purchased a home order to ensure that their children would be zoned to PS 8 (Hannah-Jones 2016). As a result, they have threatened to move out of the neighborhood or take their children out of the public school system altogether. White parents in PS 199 also shared the same concerns. One parent said, “People can move. Parents have options” (Taylor, Nov. 2016). Therefore, in these comments, white parents are demonstrating their freedom in choice and ability to be mobile in order to find the best education for their children (Roda and Wells 2013).

The purpose of this paper is to display the responses of low-income parents of color to the rezoning of their schools. This section has been particularly focused on the concerns of white families and their mobility because the voices and concerns of low-income parents of color are few and far between. Some research indicates that low-income minority parents have confronted exclusive practices when trying to receive information about New York City public schools (NY Appleseed 2013). Others have written about how there were few comments or concerns about the rezoning expressed by parents in schools like PS 307 and PS 191 because they were unaware of or had inaccurate information in regards to the proposal up until a few months before it was supposed to be voted on (Taylor, Oct. 2015). Additionally, many of these parents do not have the same privilege of moving outside of their neighborhoods if their public schools are not performing at a level deemed to be “good” nor do they have the networks, resources, or time that many middle and upper-class families have to research better choices that are available to them (Hannah-Jones 2016). For this reason, mobility and choice play an important role in the debate that surrounds rezoning because mobility or the lack thereof influence school composition and neighborhood composition. As a result, the presence of certain families influences the resources, networks, perceptions, and culture of a school.

Resources, Networks, and School Culture

In UCLA’s study about New York State school segregation, Kuscera and Orfield write, “data also indicate that as a school becomes more minority, the school will also become more low-income and, as such, is twice as likely to exhibit educational opportunities and outcomes.” For this reason, many praise socio economic and racial integration by white upper and middle class families as a means to achieve better educational networks, resources, and opportunities.  However, the high appraisal of these resources and networks creates tension for low-income minority parents in terms of expectations for parent involvement and contribution and school culture.

At PS 199, “the parent-teacher organization can raise about $800,000 a year to pay for things like a resident chef” whereas in PS 191, “there is no library or art teacher” (Taylor, Oct. 2015). Posey-Maddox would cite this disparity in funding as one of the ways in which white middle-class and upper-class parent involvement and fundraising in “recreate new patterns of inequality within schools” (92-3) because they create new norms and expectations that are exclusive of low-income and minority parents. Wealthy families tend to have greater networks, resources, and time that they could dedicate to the school whereas parents who need to work multiple jobs or long hours in order to make ends meet might not have the same flexibility or availability. For this reason, the positive contributions from white families, which tend to be more visible and tangible within the school, are more valued than the contributions of parents of color (Posey-Maddox 2014). This change in school culture and valuation of parent involvement is a great concern for parents of color in PS 307 because they do not want to feel excluded from schools that they “fought hard to build” and “dedicated” themselves to (Taylor, Sept. 2015).

Additionally, these parents are also resistant to rezoning because they fear that the school demographic will change dramatically and their children will be displaced from their zoned schools (Taylor, Sept. 2015). As white middle class families are moving into these zoned schools, their children are also taking up seats that low-income and minority students would otherwise be given. Parents of color fear that demographic shift this will also affect the school’s “commitment to everyone” in that it will start to focus its resources and funding on the new incoming students (Posey-Maddox 2014). An example of this is in the Title I grants that schools like PS 191 and PS 307 receive based on the number of students who quality for free and reduced-price lunch. This money can be allocated to support after-school or enrichment programs, teaching staff, and other gaps in the school budget (Posey-Maddox 2014). The influx of white middle-class and upper-class students, however, threatens this funding and endangers the programs that help and support low-income students in these schools.

“White is Right”: Racializing Good and Bad

One of the purposes of rezoning is to alleviate the overcrowding that PS 8 and PS 199 have by reassigning a few blocks to the zones that have schools like PS 307 and PS 191 which are under enrolled. However, the main argument from the wealthy white parents against rezoning is that their children would be zoned to “bad” schools and “dangerous” schools (Taylor, Oct. 2015). Although these parents do not claim to be racist, their choices indicate an underlying association between whiteness and the good quality of a school because “white schools – with white parents – are often assumed to be better than ‘black’ schools” (Posey-Maddox 2014). Nikole Hannah-Jones also discusses the way in which, for these incoming white middle and upper-class families, diversity is a “boutique offering.” They want just enough for their children’s sake, but not too much so that the school is overrun by predominantly low-income minority students. Because of this mindset, many parents of color from PS 307 and PS 199 find themselves defending the perception of their schools against these parents’ claims in order to “prove their worth and success in the public eye” (Posey-Maddox 2014). They encourage these parents to actually come and visit the schools rather than evaluating its quality based on test scores and suggestions from their peers (Roda and Wells 2013). These parents of color are also angry because the concerns and attention for these schools stem from the new presence of wealthy white families and their social capital. Why is a school labeled as “good” once there is a critical mass of white students within its walls? Why should a black student have to sit next to a white student to deserve better funding, facilities, and resources? Hannah-Jones found that PS 307, although low-income, predominantly black and Latino, and labeled by many other parents as “bad”, was incredible space in which children were genuinely learning and enjoying their time in the classroom. Schools, therefore, are described in incredibly limiting and exclusive ways that marginalize the efforts, contribution, and achievement of families of color and perpetuate the notion that whiteness is a marker of success.

Suggestions and Conclusion:

            After a two-year battle, PS 8 and PS 307 were rezoned to the sections that are evident below (Taylor, Jan. 2016). However, the proposal to rezone PS 199 and PS 191 was dropped by the city because of the intense push back from parents of color and white parents alike (Taylor, Nov. 2015). The balance needed to achieve integration that benefits both low-income minority and white is incredibly fragile, as evidenced by the way that PS 8 has progressively become whiter over the last 4 years (see chart below). This policy memo fails to address the nuances of integration and segregation when black middle and upper-class families are also part of the gentrifying families in these neighborhoods. Nevertheless, this report demonstrates the way in which an attempt to create integration can be incredibly exclusive and marginalizing of families of color. Rather than creating policies with the new white middle and upper-class families in mind, policy and school administrators also need to consider their positions and sentiments, even if they do not have the same social capital or resources as their white counterparts. One possibility is reserving places within these schools for low-income and minority students before enrolling other students. Inclusion and diversity needs to be a concerted effort on all levels, from parent-teacher organizations to admissions within schools to the drawing and redrawing school zones. The needs of parents and students of color should not be an afterthought or a “boutique offering”, but rather a priority in order to create authentic integration and equity within New York City schools.

Works Cited

Burns Stillman, Jennifer. 2012. Gentrification and Schools. New York: Palgrave Macmillan.

Fuller, Howard. 2004. “The Struggle Continues.” Education Next 4(4).

Hannah-Jones, Nicole. 2016. “Choosing a school for my daughter in a segregated city.” The New York Times.

Higgins, Michelle. May 2013. “The Get-Into-School Card.” The New York Times.

Kahlenberg, Richard. 2001. All Together Now: Creating Middle-Class Schools through Public School Choice. Ch 1, Pp. 1-11. New York: Brookings Institution Press.

Kucsera, John and Gary Orfield. 2014. “New York State’s Extreme School Segregation: Inequality, Inaction and a Damaged Future.” UCLA: Civil Rights Project/Proyecto Derechos Civiles.

New York Appleseed. 2013. “Segregation in NYC District Elementary Schools and What We Can Do About It: School to School Diversity.”

Posey-Maddox, Linn. 2014. When Middle-Class Parents Choose Urban Schools. Chicago: The University of Chicago Press.

Orfield, Gary and Chungmei Lee. 2007. “Historic Reversals, Accelerating Resegregation,a nd the Need for New Integration Strategies.” UCLA: Civil Rights Project/Proyecto Derechos Civiles.

Roda, Allison and Amy Stuart Wells. February 2013. “School Choice Policies and Racial Segregation: Where White Parents’ Good Intentions, Anxiety, and Privilege Collide.”American Journal of Education 119(2): 261-293.

Saporito, Salvatore and David Van Riper. 2015. “Do Irregularly Shaped School Attendance Zones Contribute to Racial Segregation or Integration?” Social Currents 3 (1): 64-83.

Taylor, Kate. September 2015. “Race and Class Collide in a Plan for Two Brooklyn Schools.” The New York Times.

Taylor, Kate. November 2015. “Education Dept. Drops Proposal to Rezone Upper West Side Schools.” The New York Times.

Taylor, Kate. October 2015. “Manhattan Rezoning Fight Involves a School Called ‘Persistently Dangerous’.” The New York Times.

Taylor, Kate. January 2016. “Harlem Schools Are Left to Fail as Those Not Far Away Thrive.” The New York Times.

Taylor Kate. January 2016. “2 Brooklyn Schools in Gentrifying Area Will Get New Zones.” The New York Times.

Taylor, Kate. September 2016. “Rezoning Plan for Manhattan Elementary School Draws Anger from All Sides.” The New York Times.

Wells, Amy Stuart, Lauren Fox and Diana Cordova-Cobo. 2016. “How Racially Diverse Schools and Classrooms Can Benefit All Students.” New York: The Century Foundation.

The Origin of Unions and their Application to Teachers

The Origin of Unions and their Application to Teachers

To: Congresswoman

From: Brian Pok, Congressional Aid

RE: Teacher’s Unions

Date: April 29, 2017

Executive Summary

Introduction

This policy brief seeks to summarize the historical origins of teacher’s unions and how they have evolved to fit the needs of teachers to shape policy concerning the educational system. More specifically, it will seek to evaluate the nature of these unions and how they have evolved from their original spirit and capabilities. Given the nature of unions today and how they have evolved in the case of teachers to become more like special interest groups, changes are necessary to better regulate such unions. First, special interest groups must be limited in the amount of money they can spend on political contributions. Second, the nature of unionization needs to change to prevent the misalignment of interests in cases where essential goods are at stake. While other research has examined the pros and cons of teachers unions and why they may be helping or hurting education reform today, this report is the first to examine the ways in which teachers’ unions have evolved the category of unions to become more than advocacy groups with an ability to influence education policy. It highlights ways in which money has played a critical role in distorting the nature of unions – in the case of teachers’ unions – and examines why this may be harmful from a philosophical point regarding public interest.

Background

A topic of major contention between liberals and conservatives education policy debates today revolves around the idea of teacher tenure and whether it is helping or hindering education reform. Yet the more important matter in determining whether even sub-issues like teacher tenure can even begin to enter a discussion is the role that teacher’s unions play in education reform. Those who are against tenure often argue that union-negotiated employment policies protect mediocre and bad teachers from consequences of lackluster or even harmful performances and that teachers who feel misrepresented or have no desire to belong to a union are nevertheless forced to pay mandatory fees for these organizations. On the other hand, those in favor argue that unions protect teachers from arbitrary administrative decisions and politically influenced teacher appointments. Moreover, it gives teachers the ability to express intellectual points and ideas that may be controversial in their respective communities such as topics like evolutionary biology. While there are certainly many opinions about tenure, the problem with even discussing reform measures is that teacher’s unions are categorically against cutting back on any protective measures for their members, even when those measures may need to be updated or reformed.

The Rise of Unions

Unions were originally conceived in the 18th century under the industrial revolution in Europe, during which there was a drastic surge in new workers due to the developing technological advances of the age. Many of these unions emerged out of labor movements in a time when many of the jobs migrated from rural to urban centers as nascent industrialization started taking place in these regions. Evidently, as many of these large businesses started making disproportionate amounts of money off the backs of poorly compensated workers and as mechanization saw dangerous machines being introduced into factories making work-life more hazardous, workers started to band together to reduce this uneven distribution of power. They essentially bargained for more rights such as increased pay and better working conditions and as a result, the working population was better protected from abuse, leading to improved job quality, safety, and overall pay. National unions in the U.S. started to emerge in the 19th century starting in 1866 when the NLA or National Labor Union was created to convince Congress to limit the workday for federal employees to 8 hours. Subsequently 5 years later, the American Federation of Labor (AFL) was founded, and the combined efforts of the unions softened Congress to a degree that the Department of Labor was created and the Clayton Antitrust Act of 1914 was passed to allow employees to strike and boycott. (Cussen) Perhaps the greatest achievements of labor unions were the ones that followed. The Public Contract and the Fair Labor Standards Act, which were passed in 1936 and 1938 respectively, mandated a minimum wage as well as extra pay for overtime work. Currently however, as more and more laws have been passed protecting worker and human rights, including gender equality laws mandating equal pay for equal work, the importance of labor unions have started to decline as workers were now able to rely more on federal laws and even the courts which now had jurisdiction to uphold and interpret existing laws and less on labor unions.

Benefits of Unions

Today, the two largest and most powerful teachers’ unions that emerged from the union movement are the AFT – American Federation of Teachers, and the NEA – National Education Association, which were founded in 1916 and 1857 respectively. Like the origins of labor unions, teachers’ unions like the AFT and NEA emerged out of a need to protect teacher’s from terrible working conditions, nepotism in hiring, political backlash, and to advocate for intellectual freedom. Diane Ravitch, a historian of education and educational policy, points to how teachers before unions were grossly mistreated. First, teachers were oftentimes fired by the Board of Education for getting married, as in the case of Mary Murphy in 1891; or even pregnant, as in the case of Bridget Pexitto in 1913. Second, unions helped win equal pay for women as evidenced by the efforts of the Interborough Association of Women Teachers, a teacher’s union, which started a campaign in 1906 advocating for equal pay across genders, ultimately getting it passed in 1912. Finally, unions have historically played a role in defending teachers from administrative incompetence and bias. They protect teachers from corporate style reformers who pump out principals from “quickie” principal programs that have little classroom experience and who lack enough understanding to make wise decisions about curriculum or how to evaluate teachers. (AFT) Ultimately, teachers’ unions are invaluable in that they check administrative power and the threat of teachers being left out from integral every-day decision-making processes in the education system.


The Power of Teacher’s Unions Today

What is different in the case of modern day teacher’s unions however is the degree to which they hold power and the extent to which they have enhanced, or rather supercharged their political capabilities. There is evidence to suggest that they have essentially evolved to become unaccountable legislative bodies. In 2010, Andrew J. Coulson, director of the Cato Institute Center for Educational Freedom, released a report evaluating the effectiveness of teacher’s unions in achieving 5 primary goals for its members; 1) raising their members wages, 2) growing their membership, 3) increasing the share of the public school labor force that they represent, precluding pay based on performance or aptitude, and 5) minimizing competition from nonunion shops. (Coulson, 2010).

The data shows that public school union membership has nearly sextupled in the past 50 years, while the share of union members has nearly doubled, vastly outpacing the growth rate of unionized teachers. In addition, teacher’s unions have been able to capitalize on the power of their member base by minimizing competition via lobbying elected officials to “oppose policies that give charter schools, vouchers, and education tax credits.” (Coulson, 2010) Considering that nearly $600 billion in government educational spending goes to public schools, it makes sense that these unions would want to prevent that money from going to nonunionized schools. To maintain their legislative sway, unions lobby with seemingly exhaustive amounts of money. According to the Center for Responsive Politics, the NEA and AFT, the two main teachers’ unions, have combined spent more than $56 million on political contributions since 1989, which is about as much as Chevron, Exxon, Mobil, the NRA, and Lockheed Martin combined. (2016) With such a large amount of money allocated towards garnering political opinion, these special interest groups have managed to make blue-collar labor unions from the 1800s blush by what they could achieve; become dominant legislative power-players. The nature of unions in the case of teacher’s unions has evolved to become more than just a force for collective bargaining against employers. They have come to not only set the conditions for their members, but also set the rules of the educational system. The reality is, it is nearly impossible to touch possible areas of reform, even in cases of minor change because political clout in the form of members and funds make it impractical to do so.

Essential Goods

Given the capability of teacher’s unions today, the relevant question is, do their current interests and powers align with those of the public? This is perhaps the most important issue at hand and that would be difficult to answer without fleshing out the more philosophical and finer points of education and its role in society. Education for the most part can be considered an essential good and to a certain extent, a public good. Teachers are naturally fundamental providers of that good, but are themselves not the primary beneficiaries of education, students are. Thus, scenarios in which students are disadvantaged at the expense of a secondary actor, even if the imbalance created is one to a hundred, would be a betrayal of the essential good. This is analogous to the principle upon which our current legal system operates; innocent before proven guilty. Our society fears miscarriages of justice so much so that it would rather favor setting 100 guilty men free than convict 1 innocent person. Likewise, it is likely that the much of the uproar caused by U.S. society over teacher’s unions is due how teacher’s unions are perceived today – that they do not inherently have the interests of student’s first. As a result, they have faced significant public opposition and disfavor. This is perhaps reflected in public opinion surveys conducted in recent years showing decreased approval ratings of teachers’ unions, even amongst teachers, by a remarkable 16 percent from 2011-2012. (Peterson) Among their concerns are that unions are not fighting hard enough for their interests while others think they might be in the way of education reform.


Recommendations

In order make improvements on the current situation, 2 key reform measures must take place. First, special interest groups like teachers’ unions must have limits on the amount of funding they can contribute to political campaigns/candidates. Given the current political and legal system, special interest groups disproportionately influence public policy through money, so much so that it has introduced significant distortions in how advocacy is done today. Discussions on topics of education reform have little impact unless absolute stopgaps due to funding are removed. Second, the nature of unionization in education must change such that interests are not misaligned. Unions represent the interests of its members and should not be expected to nor do they inherently represent the interests of anyone else. To claim that a doctors union represents the interests of patients or that a lawyer’s union represents the interest of clients is inherently false. Likewise, teacher’s unions do not have students as their primary interests. The teachers who pay dues to the unions are the ones that they are responsible to and represent, not the students. The biggest problem concerning teacher’s unions now are the fact that they hold a monopoly not only on how federal funds are allocated, but also on teacher’s themselves. Many teachers are either forced to subscribe to a union or else take an uncompetitive contract elsewhere. Currently in the United States, 22 states are non-right-to-work states, meaning that teachers must either join their district’s affiliated union or pay a union fee. These union fees must be paid under the rationale that their contract is a result of union representation. It is possible that as union membership continues to grow, these fees may continually increase, leading to further increases in union power. If representation ever becomes exclusive, economic freedoms and mobility may be further restricted as union oversight into administrative matters such as hiring and laying procedures will continue to increase. To counter such a result, unions should be forced to compete with non-unionized schools and teachers. Passing right-to-work laws is a start to protecting teachers from being forced to join or support a labor union in order to teach, checking union power and fundraising capability to a limited degree. These recommendations are not to say that unions need to be done away with. In fact quite the opposite, unions are a necessary protective force that ensures teacher’s interests are represented and that teachers have a platform for voicing concerns. Most of all, they check the power that administrators and even students can have over teachers, making sure that basic rights are being upheld. However, these recommendations need to be implemented to prevent abuses from arising due to unchecked political power such that the organization itself becomes the end rather than the means for effecting change. Furthermore, it will help maintain the historic nature of unions: to serve as a vehicle for protecting the rights of teachers, rather than seeking to further its own interests.

Drawbacks and Limitations in Proposed Recommendations

            First, trying to pass laws limiting funds used to lobby to politicians will be difficult, if not nearly impossible as this would go against their own interests. Second, passing right-to-work laws also have the drawback of reducing union power to such a degree that they are unable to force schools to negotiate with them, leading to possible wage decreases and reductions in safety standards or other benefits. Moreover, teachers’ unions are likely to oppose these recommendations as they threatens their current ability to retain power, whether it be to recruit members, influence politicians, or negotiate with school districts. One alternative would be to lobby teachers and inform them about their rights in regards to union membership so that they are better informed or are able to make a decision without fear of union backlash or peer pressure. This may have the added effect of keeping unions in check from coercing members into silence and may force them to listen to their members as to how they would like their funds be used or what kind of representation they would like. Ultimately however, removing these distortions in union power necessitates limitations to political contributions as well as coercion based on job availability, but a start would be raising greater awareness in these areas so that teachers themselves are able to standup against union pressure.

Conclusion

            This policy brief addressed the historical origins of teacher’s unions and how they have evolved to in their spirit and capabilities to become more like special interest groups with substantial power, much greater than what unions of the past were able to obtain. The following recommendations: first, that special interest groups be limited in the amount that they can use to lobby elected officials; and second, that states and school districts act to naturally check union power by passing right-to-work laws and informing teachers of their rights in regard to unions, will are potential avenues by which teacher’s unions can be kept accountable in regards to not only their members, but also to the public as providers of essential goods. While it may not be realistic to expect lawmakers to pass laws limiting how much special interest groups can spend on swaying political opinion, increasing awareness among teachers in regards to their rights in dealing with unions may force the unions to better listen to them. Moreover, making clear the benefits and drawbacks to unionization may lessen the information gap by which unions are able to capitalize on teachers’ fears. Ultimately, unions in the case of teachers have become far more powerful in their ability to pull political power and therefore control over education policy, making efforts at reform nearly impossible. The two primary causes for this distortion have been the unchecked extent to which unions have been able to amass funds from its base to sway political opinion as well as the degree to which teachers are either forced to join unions in non-right-to-work states or pay a fee for representation they do not agree with. Given the current situation in which teachers’ unions hold considerable influence in education policy regarding teachers, efforts at reform – even minor ones – are nearly impossible. Unions are an important advocacy group that is and will always be necessary. However like any other special interest group, they will continue to secure greater benefits at the expense of other groups if left unchecked.

Acknowledgements

I would like to personally thank Emil and George for their comments in regards to my rough draft, especially regarding my grammar and syntax issues and ways I could address potential limitations in my recommendations. Furthermore, their points in addressing the objectivity of my paper were of great help and led me to think more about the ways I could address the issues from a more neutral point of view. Last but not least, I would like to thank the EDST 245 class as well as Professor Debs and Clare for their instruction throughout the semester.

Works Cited

Cussen, M. (2016). The History of Unions in the United States. Retrieved from http://www.investopedia.com/financial-edge/0113/the-history-of-unions-in-the-united-states.aspx

Coulsen, A. (2010). The Effects of Teachers Unions On American Education. Retrieved from https://object.cato.org/sites/cato.org/files/serials/files/cato-journal/2010/1/cj30n1-8.pdf

The Center for Responsive Politics. (2016). Top Contributors 2015-2016. Retrieved from https://www.opensecrets.org /industries/indus.php?ind=L1300

Peterson. P, Howell, W., & West, M. (2013). A Bridge to the Future 2013 Report. Retrieved from https://www.hks.harvard.edu/pepg/PDF/Annual_Reports/2013AR.pdf

Ravitch, D. (2007). Why Teacher Unions Are Good for Teachers – and the Public. Retrieved from http://www.aft.org/periodical/american-educator/winter-2006-2007/why-teacher-unions-are-good-teachers-and

Massachusetts and the Charter Cap: Accountability, Balance, and Implications for the Nation

Emil Friedman

EDST 245

Final Policy Paper

Spring 2017

Massachusetts and the Charter Cap: Accountability, Balance, and Implications for the Nation


Executive Summary

As the United States continues to grapple with developing a comprehensive education policy that strikes a balance between supporting neighborhood public schools and acknowledging the progress, particularly in low-income and minority communities, made by charter schools, this paper examines the Commonwealth of Massachusetts as a potential example for the nation. While other research has examined Massachusetts’ charter school academic performance and journalists have extensively covered the state’s 2016 charter cap referendum, my report is one of the first to treat Massachusetts as an extended case study upon which a federal policy could be based. After describing the high stakes that characterize school choice debates, I track the purpose of charter schools, defining them both in terms of theory and Massachusetts state law. I then offer a comprehensive profile of Massachusetts’ approach to charter schools, including an analysis of Massachusetts’ charter cap system alongside an examination of various data trends accompanying the policy, including the conclusion that the cap seems to have produced charter schools which appear to be serving Boston’s and other urban areas’ low-income and minority communities particularly well, although this pattern is not necessarily replicated in non-urban schools. I then take a turn towards the political, describing Massachusetts’ 2016 referendum on lifting its charter cap, closing the paper with a discussion of a hypothetical federal charter cap based upon the one found in Massachusetts.

Introduction

This paper will attempt to make a largely objective, unbiased assessment of Massachusetts’ charter school landscape. As I open the paper, however, I qualify that the stakes behind this kind of work are perhaps loftier, perhaps more normative, than pure public policy analysis. This – the ways that American students, particularly those who are vulnerable, are educated in publicly-funded schools – matters because it speaks to what this nation can accomplish. Will America embrace one of John Dewey’s core purposes of education, the potential for social mobility[1], by which everyone who works hard can get ahead, or will it retreat to, as President George W. Bush termed, the soft bigotry of low expectations, particularly for high-needs students? Will America remain stubborn in its politically-motivated, interest-group-centered approach to education policy, or will it finally view our nation’s most important job – educating its children – as a mission sacred enough to avoid the partisan fray? Will America be willing to challenge the status quo?

In short, the principles that drive the criteria of this paper, the rubric it takes to Massachusetts, are deeply ideological. This is not merely a discussion of granular policies in a single state. This is a microcosm of the difficult, ultimately student-focused, results-motivated investigation we must take to the nation. The stakes could not be higher.

Background: Charter Schools in Massachusetts

Precise legal definitions of charter schools can be nebulous and vary by state. In Massachusetts, a charter school “is a public school that is governed by a board of trustees and operates independently of any school committee.”[2] Charter schools have significant flexibility in terms of pedagogy, curricula, and budgeting, while being mandated to produce acceptable academic results in exchange for charter renewal. Specific to Massachusetts is a distinction between “Commonwealth” schools and “Horace Mann” schools. Horace Mann schools are required to have their charters approved not only by the state Board of Education, but also by a local school committee and, in some cases, a local teacher’s union, while Commonwealth schools are free from this increased obligation.[3]

One purpose accepted by scholars of charter schools is for them to serve as neighborhood-driven public education laboratories, using their relative freedom from state and national guidelines to experiment pedagogically and ultimately serve as models for district public schools while tailoring instruction to the communities in which they exist.[4],[5] Massachusetts state law codifies this purpose in G.L. c. 71, § 89, which, in part, states that charter schools are to be established “to stimulate the development of innovative programs within public education” and “to provide models for replication in other public schools.”[6]

In the twenty years since the first Massachusetts charter school opened following the passage of the Massachusetts Education Reform Act of 1993, charter schools both nationwide and within Massachusetts have strayed from their original, neighborhood-driven roots and have become increasingly corporatized; statewide, parents of students in charter schools comprise only 14% of charter trustees, with more than double that percentage – 31% – comprised by corporate representatives. A whopping 60% of charter schools have no parent representation on their boards of trustees, and these charter schools tend overwhelmingly to serve low-income, majority Black and Latino communities.[7] Indeed, charter schools in Massachusetts have grown far from their grassroots origin. This increasingly corporatized environment exacerbates the politicization of charter schools in Massachusetts, increases partisanship in education policy debates, and forms a critical lens through which this paper will investigate charter performance.

Massachusetts’ Charter Cap: Definition and Purposes

The tool Massachusetts uses, in part, to counter the corporatization trend – the tool whose effectiveness this paper will address – is known as a charter cap. This cap represents a clearly-defined limit of charter growth in the state, designed to strategically target communities with underperforming district schools and limit charter presence in communities with high-performing district schools. Among other criteria, Massachusetts’ cap limits the number of charter schools approved in a school district with student standardized test performance in the top ten percent statewide to only one per year, mandates that at least two charter schools per year be approved in school districts with student standardized test performance in the bottom ten percent statewide, and restricts Commonwealth charter schools (again, the more “laissez-faire” of the two types of Massachusetts charter school) to communities with populations over 30,000.[8]

The purposes of Massachusetts’ charter cap are several. First, the cap helps ensure that funding for district public schools is stable and reliable. Because students attending charter schools carry with them funding that otherwise would go to their public school district, capping charter schools means that district leaders can predict yearly funding more easily based upon the number of charter schools authorized in their district. Second, the cap is designed to produce favorable academic results for students; by forcing many charter startup groups to apply for only a low number of charter allowances, natural competition forces charter schools in Massachusetts to perform relatively highly; this paper will investigate this purpose further. Third, the exact specifications of the charter cap can serve as a political chess piece: in negotiations with unions and corporate special interests, generally limiting charter schools while allowing for some to exist alongside district public schools nudges Massachusetts’ education landscape towards the middle, politically, rendering it more likely to satisfy competing interests.

By the Numbers: Charter School Landscape Under Massachusetts’ Cap

Beyond the policy on paper, Massachusetts’ cap has produced a significantly stratified charter school landscape by a variety of metrics. Here, I present and discuss trends in Massachusetts charter schools, reported by Massachusetts’ Department of Education, current as of the 2016-2017 school year.[9]

(Figure 1)

Charter schools in Massachusetts do not tend towards any particular grade level and instead are somewhat equally distributed across elementary, middle, and high school levels (Figure 1). This suggests, but does not confirm, a significant feature of Massachusetts’ charter system: there seems to be consistency in that students would tend to enter the charter system and stay in the charter system for their entire schooling instead of moving between the charter system and neighborhood public schools. An interesting further study of the health of Massachusetts’ charter system would investigate the retention rates of Massachusetts charter schools in contrast with their district public school counterparts.

(Figure 2)

Another important measure of charter school equity is the distribution of student populations served. Massachusetts charter schools tend to serve populations that are, in general, more socioeconomically vulnerable than the state as a whole, save for special education (Figure 2). It is important to add, however, that Massachusetts charter schools’ not serving a representative portion of special education students is a common trend nationwide. In contrast, serving other groups of vulnerable students as equitably as Massachusetts charter schools seem to do is not a norm; some charter schools, particularly in cities, participating in “creaming,” or selecting deliberately for higher-achieving, lower-needs students.[10] Creaming does not appear to be a widespread trend in Massachusetts, which is a fair indicator that the state’s charter system is being run responsibly in terms of access and original purpose.

(Figure 3)

Alongside an examination of populations served should come an examination of charter demand. Although an exact demographic breakdown of waitlisted students is unavailable, about a quantity equivalent to three-fourths of current charter school students are on a waitlist (Figure 3). This is a critical figure because Massachusetts’ charter cap, by definition, limits the number of students enrolled in charter schools. This premise would form a basis of a 2016 referendum on lifting the charter cap, discussed later in this paper.

(Figure 4)

In line with the socioeconomic trends described by Figure 2, Massachusetts’ charter schools tend to serve a disproportionately minority population, with only half the state average of white students attending charter schools. Charter schools overall serve about one-third white students, one-third Hispanic students, and one-third Black students (Figure 4).

(Figure 5)

Explaining the demographic trends indicated in Figures 2 and 4 is the breakdown of charter schools in Massachusetts by community type. Charter schools tend overwhelmingly to be in urban areas – Boston and other cities – aligning with the typical trend that lower-income and minority populations tend also to be concentrated in cities (Figure 5). This makes sense in terms of the text of Massachusetts’ charter cap law itself, which, as discussed in the Definition section, places an emphasis on lower-performing school districts (tending towards cities, not suburbs) and higher population districts, with Commonwealth charter schools prohibited in communities with fewer than 30,000 residents.[11]

(Figure 6)

A key statistic provided by the state Department of Education complicates the trend found in Figure 3: while state charter schools overall have a lengthy waitlist, not every charter school is at capacity, because the total number of students attending charter schools is lower than the total maximum enrollment allowed under charters authorized by the cap (Figure 6). This suggests that charter demand is concentrated in certain areas and relaxed in others.

In fact, charter demand is concentrated strongly in Boston: out of the 32,600 students on charter waitlists, a full 10,300 reside in Boston, even though Boston is already the highest-spending district in Massachusetts on charter schools, at 14% of the total district budget. On the other hand, Amherst, which is richer and whiter than Boston alongside a relatively high-performing district, has a charter waitlist under 100.[12]

In broader terms, we can conclude that charter schools in Massachusetts overwhelmingly serve lower-income, minority populations. In terms of the cap, demand for greater enrollment is heavily concentrated in cities, especially Boston. This would set the stage for the political landscape characterizing the 2016 referendum.

By the Numbers: A Brief Overview of Massachusetts Charter School Performance

One of the key goals of a charter cap is that limiting charters will force charter schools, while competing for authorization slots, to develop a high-quality school plan that would translate to excellent academic results for students. In practice, however, examining Massachusetts charter schools tells two stories.

The first is a story of urban charter schools, and the story has a happy ending. Urban charter high schools overall saw a standardized test improvement per year of 0.39 standard deviations in math and 0.27 in English, showing the legitimate progress that urban charter schools are making, particularly for the vulnerable students that urban schools serve. Similar statistics are found at the elementary and middle school levels.[13]

We find a completely different story in non-urban charter schools, where enrollment demand is much lower than that in urban areas. Unlike their urban counterparts, non-urban charter high schools overall saw a standardized test decrease per year of -0.30 in math and -0.05 in English. Similar statistics are found at the elementary and middle school level.[14] Broadly speaking, then, non-urban charter schools actually tended to hurt students, not help them.

From a policy standpoint, this disparity raises a key problem with the way Massachusetts’ charter cap currently works. While it does already show favoritism to urban charter schools, not non-urban, from a purely performance-based point of view, Massachusetts’ balance still is off; if the state designed the policy exclusively to maximize academic gains, it would raise the cap in urban areas and lower the cap in non-urban areas. Regardless, it would be inaccurate to state that charter schools at large in Massachusetts positively serve all students; some do and some clearly do not.

The Statistics Become a Debate: Massachusetts’ 2016 Charter Cap Referendum

Massachusetts voters had a say in the charter cap debate when they were offered a referendum in the 2016 election, voting on a proposal that would increase the yearly charter quota by twelve schools.[15] Within that proposal was a stipulation that priority to charter authorization would be given to school districts in the lowest 25% of the state, and the growth in charter school enrollment could not exceed one percent of statewide total enrollment.[16] These stipulations seem reasonably based on the evidence and conclusions drawn earlier in this paper.

Since the ballot initiative was introduced in 2015, the political forces in favor of the cap raise were steady and loud. Beth Anderson, chairwoman of the board of the Massachusetts Charter Public School Association, cited the over 30,000 students on waiting lists in her initial statement, stating that “these families deserve better.”[17] In a state where Anderson had political allies in the governorship and Department of Education under Republicans Governor Charlie Baker and Secretary of Education Jim Peyser, this sentiment was naturally echoed by Massachusetts’ executive branch. Republicans in the state legislature generally fell in line with this position as well.

The political landscape was far more complicated on the Democratic side.[18] Most significantly, the Massachusetts Democratic Party – the state branch of the national party – and many members of state legislature’s Democratic caucus found themselves on opposite sides, with the former advocating against the raise and the latter showing support.[19] In fact, a dramatically visual representation of this split was found at the Democratic National Convention in Philadelphia during the summer of 2016, where Democrats for Education Reform and top pro-raise leaders Senator Michael Rodrigues and Representative Frank Moran hosted several official pro-charter breakfasts, much to the dismay of party leadership itself.[20] The optics of this spectacle, particularly for a nationally-fractured Democratic party, were hardly ideal.

Unsurprisingly, the partial Democratic opposition to the pro-raise movement was bolstered by state teacher unions as well as the national arm of the American Federation of Teachers.[21] In terms of tactics, the pro-raise and anti-raise sides different significantly. The pro-raise side outraised the anti-raise side, accepting sizable donations from Michael Bloomberg and investors in Massachusetts.[22] Money also flowed in from super-PAC-like “dark money” groups like “Strong Economy for Growth” and “Education Reform Now Advocacy.” Much of the over $25 million spent by this side was used for statewide television advertisements.[23] In contrast, the anti-raise side raised most of its funds from unions, but found political capital in the form of powerful endorsements by U.S. Senator Elizabeth Warren[24] and Boston Mayor Martin J. Walsh.[25] The side also drew upon its vast group of teacher supporters, mobilizing them to phone-bank and canvass by the hundreds of thousands.[26]

Ultimately, the referendum to raise Massachusetts’ charter cap was voted down, 62-38%.[27] Once more data is available, an interesting research project would be an analysis of how effective different political tactics were for this referendum, especially because the side that lost still had more funding than the winning side. It would also be interesting to investigate what knowledge the electorate had of the relative performance of the charter cap in terms of progress for vulnerable, urban students, a reality that potentially was lost amid fierce union opposition campaigns.

Looking Forward: A Federal Charter Cap and the Potential for a New National Education Policy

Even though Massachusetts’ 2016 referendum saw national attention, charter caps and quotas are currently a state legislative issue. As the nation continues its sequence of modern comprehensive education policies – first No Child Left Behind, then Race to the Top, then the Every Child Succeeds Act – the potential to get closer to a solution to national school choice debates would be found in a national charter cap. Although speculative at this point, a federal charter cap could include a plan for determining charter authorization based upon city populations, performance of neighborhood school districts, and other metrics like those that Massachusetts’ cap uses.

Precedent for a federal policy as far-reaching as this proposal is found in the way education policies are “enforced” at the federal level: as gauges for funding. Just as Race to the Top used federal funding as a carrot for states to follow, a potential charter cap could also include federal funding in exchange for compliance. At the same time, a comprehensive federal policy that meaningfully incorporates charter schools is likely to find fierce federal union opposition. Similarly, charter management organizations and their powerful government affairs offices would be just as likely to lobby for more flexible and generous authorization allowances to charter schools. Like other comprehensive legislation efforts, such an endeavor would require patience, compromise, and stamina.

Conclusion

No matter the granular details of a potential federal cap, evidence from Massachusetts that a charter cap can help vulnerable students in urban communities is compelling enough to warrant a closer look at an education policy that, yes, includes charter schools while carefully reconciling those charters with their neighborhood public school counterparts, especially in non-urban communities. Both politically and in terms of constitutionality, such a policy would require significant, likely bipartisan cooperation. However, motivated by the principles that fueled both Massachusetts’ cap and this paper – making tangible progress in public education, particularly for lower-income and minority American students – a renewed national focus on education policy should be a priority of the country.

Acknowledgements

I am very thankful that Harvard (the Yale of Massachusetts) has a variety of high-quality academic reports on its state’s public education system; they proved helpful to my own research. I am also thankful to Professor Debs and her course readings; their balance helped me strip some of my own politics out of my analysis in this paper in acknowledging the good that some charter schools are doing. I am finally thankful to my Keurig, which has been making a lot of coffee lately.

Endnotes

[1] John Dewey, “Democracy and Educational Administration,” School and Society 45 (April 3, 1937); 457-67.

[2] “Questions and Answers About Charter Schools,” Massachusetts Department of Education, accessed April 23, 2017, http://www.doe.mass.edu/charter/new/2015-2016QandA.pdf.

[3] “Questions and Answers About Charter Schools”

[4] Michael Fabricant and Michelle Fine, Charter Schools and the Corporate Makeover of Public Education (New York: Teachers College Press), 18.

[5] Chester E. Finn, Jr. and Bruno V. Manno, “A Progress Report on Charter Schools,” National Affairs, 2015.

[6] “Section 89,” The General Court of the Commonwealth of Massachusetts, accessed April 23, 2017, https://malegislature.gov/Laws/GeneralLaws/PartI/TitleXII/Chapter71/Section89.

[7] Leigh Dingerson, “Whose Schools? An Examination of Charter Schools Governance in Massachusetts,” Annenberg Institute for School Reform at Brown University, 2016, accessed April 23, 2017, http://www.annenberginstitute.org/sites/default/files/product/859/files/WhoseSchoolsRevised.pdf.

[8] “Questions and Answers About Charter Schools”

[9] “Massachusetts Charter School Fact Sheet,” Massachusetts Department of Education, accessed April 23, 2017, http://www.doe.mass.edu/charter/factsheet.pdf.

[10] Kate Taylor, “At a Success Academy Charter School, Singling Out Pupils Who Have ‘Got to Go’,” New York Times, October 29, 2015, accessed April 30, 2017, http://nyti.ms/1kdOsXW.

[11] “Questions and Answers About Charter Schools”

[12] Thomas Kane, “Let the Numbers Have Their Say: Evidence on Massachusetts’ Charter Schools,” Harvard Graduate School of Education, 2016, accessed April 26, 2017, https://cepr.harvard.edu/files/cepr/files/evidence-ma-charter-schools.pdf.

[13] Kane, “Let the Numbers Have Their Say: Evidence on Massachusetts’ Charter Schools”

[14] Kane, “Let the Numbers Have Their Say: Evidence on Massachusetts’ Charter Schools”

[15] Kimberly Hefling, “Democrats feud over charter schools in Massachusetts,” Politico, November 7, 2017, accessed April 30, 2017, http://www.politico.com/story/2016/11/democrats-divided-on-mass-charter-school-expansion-230888.

[16] Shira Schoenberg, “Ballot initiative would grow charter schools in Massachusetts,” MassLive, August 7, 2015, accessed April 27, 2017, http://www.masslive.com/politics/index.ssf/2015/08/ballot_initiative_would_grow_c.html.

[17] Schoenberg, “Ballot initiative would grow charter schools in Massachusetts”

[18] Nina Rees, “Lift the Cap on Charter Growth,” U.S. News, September 6, 2016, accessed April 30, 2017, https://www.usnews.com/opinion/articles/2016-09-06/lift-the-artificial-limit-on-charter-schools-in-massachusetts.

[19] Shira Schoenberg, “30 Massachusetts mayors oppose raising charter school cap: Why?” MassLife, October 26, 2016, accessed April 30, 2017, http://www.masslive.com/politics/index.ssf/2016/10/mayors_oppose_raising_charter.html.

[20] Andy Metzger, “Mass. Democrats Vote to Oppose Charter School Question,” WBUR, August 17, 2016, accessed April 27, 2017, http://www.wbur.org/edify/2016/08/17/mass-democrats-charter-school.

[21] Alan Singer, “Massachusetts Is Ground Zero In Battle Over Charter Schools,” Huffington Post, October 13, 2016, accessed April 30, 2017, http://www.huffingtonpost.com/alan-singer/massachusetts-is-ground-z_b_12467160.html.

[22] Valerie Strauss, “An extraordinary battle over charter schools is consuming this state,” Washington Post, November 7, 2016, accessed April 30, 2017, https://www.washingtonpost.com/news/answer-sheet/wp/2016/11/07/an-extraordinary-battle-over-charter-schools-is-consuming-this-state/?utm_term=.0fa16e8b6063.

[23] Paul Heroux, “Don’t Raise The Massachusetts Charter Cap Just Yet,” Huffington Post, October 15, 2016, accessed April 30, 2017, http://www.huffingtonpost.com/paul-heroux/dont-raise-the-massachuse_b_12502860.html.

[24] Joan Vannochi, “Warren weighs in on charter schools,” Boston Globe, November 1, 2016, accessed April 30, 2017, https://www.bostonglobe.com/opinion/2016/09/28/warren-weighs-charter-schools/dCWSjDFl69FgziCPo3HCkO/story.html.

[25] Valerie Strauss, “Elizabeth Warren comes out against raising cap on charter schools in Massachusetts,” Washington Post, September 27, 2016, accessed April 30, 2017, https://www.washingtonpost.com/news/answer-sheet/wp/2016/09/27/elizabeth-warren-comes-out-against-raising-cap-on-charter-schools-in-massachusetts/?utm_term=.3efed9e6e5f2.

[26] David Scharfenberg, “Mass. voters reject ballot question on charter schools,” Boston Globe, November 8, 2016, accessed April 27, 2017, https://www.bostonglobe.com/metro/2016/11/08/charter/v34OA3vMI8dRABDsFc4JuM/story.html.

[27] Scharfenberg, “Mass. voters reject ballot question on charter schools”

Bibliography

Dewey, John. “Democracy and Educational Administration.” School and Society: 457-67. 1937.

Dingerson, Leigh. “Whose Schools? An Examination of Charter Schools Governance in Massachusetts.” Annenberg Institute for School Reform at Brown University, 2016. Accessed April 23, 2017. http://www.annenberginstitute.org/sites/default/files/product/859/files/WhoseSchoolsRevised.pdf.

Fabricant, Michael, and Michelle Fine. Charter Schools and the Corporate Makeover of Public Education. New York: Teachers College Press. 2012.

Finn, Chester E., and Bruno V. Manno. “A Progress Report on Charter Schools.” National Affairs, 2015.

Hefling, Kimberly. “Democrats feud over charter schools in Massachusetts.” Politico, November 7, 2016. Accessed April 30, 2017. http://www.politico.com/story/2016/11/democrats-divided-on-mass-charter-school-expansion-230888.

Heroux, Paul. “Don’t Raise The Massachusetts Charter Cap Just Yet.” Huffington Post, October 15, 2016. Accessed April 30, 2017. http://www.huffingtonpost.com/paul-heroux/dont-raise-the-massachuse_b_12502860.html.

Kane, Thomas. “Let the Numbers Have Their Say: Evidence on Massachusetts’ Charter Schools.” Harvard Graduate School of Education, 2016. Accessed April 26, 2017. https://cepr.harvard.edu/files/cepr/files/evidence-ma-charter-schools.pdf.

Massachusetts Department of Education. “Massachusetts Charter School Fact Sheet.” Accessed April 23, 2017. http://www.doe.mass.edu/charter/factsheet.pdf.

Massachusetts Department of Education. “Questions and Answers About Charter Schools.” Accessed April 23, 2017. http://www.doe.mass.edu/charter/new/2015-2016QandA.pdf.

Metzger, Andy. “Mass. Democrats Vote to Oppose Charter School Question.” WBUR, August 17, 2017. Accessed April 27, 2017. http://www.wbur.org/edify/2016/08/17/mass-democrats-charter-school.

Rees, Nina. “Lift the Cap on Charter Growth.” U.S. News, September 6, 2016. Accessed April 30, 2017. https://www.usnews.com/opinion/articles/2016-09-06/lift-the-artificial-limit-on-charter-schools-in-massachusetts.

Scharfenberg, David. “Mass. voters reject ballot question on charter schools.” Boston Globe, November 8, 2016. Accessed April 27, 2017. https://www.bostonglobe.com/metro/2016/11/08/charter/v34OA3vMI8dRABDsFc4JuM/story.html.

Schoenberg, Shira. “Ballot initiative would grow charter schools in Massachusetts.” MassLife, August 7, 2015. Accessed April 27, 2017. http://www.masslive.com/politics/index.ssf/2015/08/ballot_initiative_would_grow_c.html.

Schoenberg, Shira. “30 Massachusetts mayors oppose raising charter school cap: Why?” Mass Life, October 26, 2016. Accessed April 30, 2017. http://www.masslive.com/politics/index.ssf/2016/10/mayors_oppose_raising_charter.html.

Singer, Alan. “Massachusetts Is Ground Zero In Battle Over Charter Schools.” Huffington Post, October 13, 2016. Accessed April 30, 2017. http://www.huffingtonpost.com/alan-singer/massachusetts-is-ground-z_b_12467160.html.

Strauss, Valerie. “An extraordinary battle over charter schools is consuming this state.” Washington Post, November 7, 2016. Accessed April 30, 2017. https://www.washingtonpost.com/news/answer-sheet/wp/2016/11/07/an-extraordinary-battle-over-charter-schools-is-consuming-this-state/?utm_term=.0fa16e8b6063.

Strauss, Valerie. “Elizabeth Warren comes out against raising cap on charter schools in Massachusetts.” Washington Post, September 27, 2016. Accessed April 30, 2017. https://www.washingtonpost.com/news/answer-sheet/wp/2016/09/27/elizabeth-warren-comes-out-against-raising-cap-on-charter-schools-in-massachusetts/?utm_term=.3efed9e6e5f2.

Taylor, Kate. “At a Success Academy Charter School, Singling Out Pupils Who Have ‘Got to Go’.” New York Times, October 29, 2015. Accessed April 30, 2017. http://nyti.ms/1kdOsXW.

The General Court of the Commonwealth of Massachusetts. “Section 89.” Accessed April 23, 2017. https://malegislature.gov/Laws/GeneralLaws/PartI/TitleXII/Chapter71/Section89.

Vennochi, Joan. “Warren weighs in on charter schools.” Boston Globe, November 1, 2016. Accessed April 30, 2017. https://www.bostonglobe.com/opinion/2016/09/28/warren-weighs-charter-schools/dCWSjDFl69FgziCPo3HCkO/story.html.