Josesph Tomchak/Julia Larimar
Woodbridge, CT
Patterns of Residence
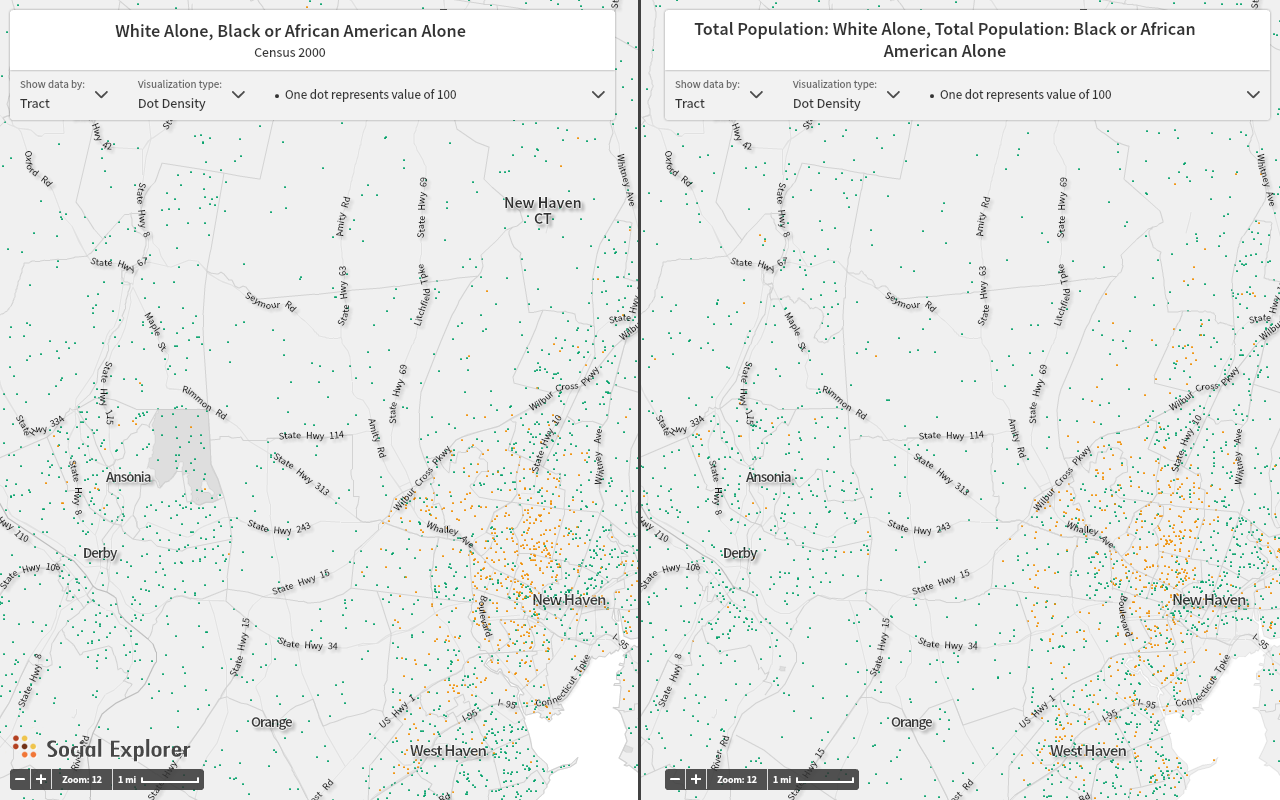
Woodbridge’s total population has decreased since the 2010 Census [1]. The town consists of 8,925 people. The racial demographics of Woodbridge are as follows: 87% white, 2% black, 3.2% Hispanic/Latino, 8.7% Asian, 0.1% Native Hawaiian, Pacific Islander and 1.7% two or more races. 17.20% of residents are foreign-born or immigrants, the highest of all the New Haven suburbs. There has not been much change in total population density since 1990. The population density of white residents has remained mostly the same as well. However, there has been an increase in proportion of Asian residents in both the northern and southern tract of the town. There was a 0.1% Asian population in 2000. Today, the Asian population makes up 8.7% of the total population of residents in Woodbridge [2].

Schools
The Woodbridge school system is comprised of only three relatively small schools in all, Beecher Road School for elementary (389 students); Amity Middle School, shared with Bethany (768); and Amity High School, shared with Orange and Bethany (1578) [3]. The only private school available in the town is a Jewish school serving students in grades K-8 from the region, but there is also access to nearby private schools in New Haven such as Foote and Hopkins; New Haven even includes Woodbridge as part of its interdistrict magnet program, even offering free transportation to those participating [4].
Schools match the relative diversity of the town overall with 78% white, 12% Asian, 4% Hispanic, and 3% black [5]. This is a slightly higher percentage of minority students, however, it is within reason given that changes have increased the percentage of minority residents in the town, perhaps indicating that the population with school age children could have slightly higher levels of diversity. This is further supported by the rise in school ethnic diversity from 7% minority students in 1993-1994 to 21% in 2013-2014 [6]. Socioeconomic diversity, however, showed far less growth with the percentage of those eligible for free and reduced lunch only increasing from 1% to 5% over the same time span [7].
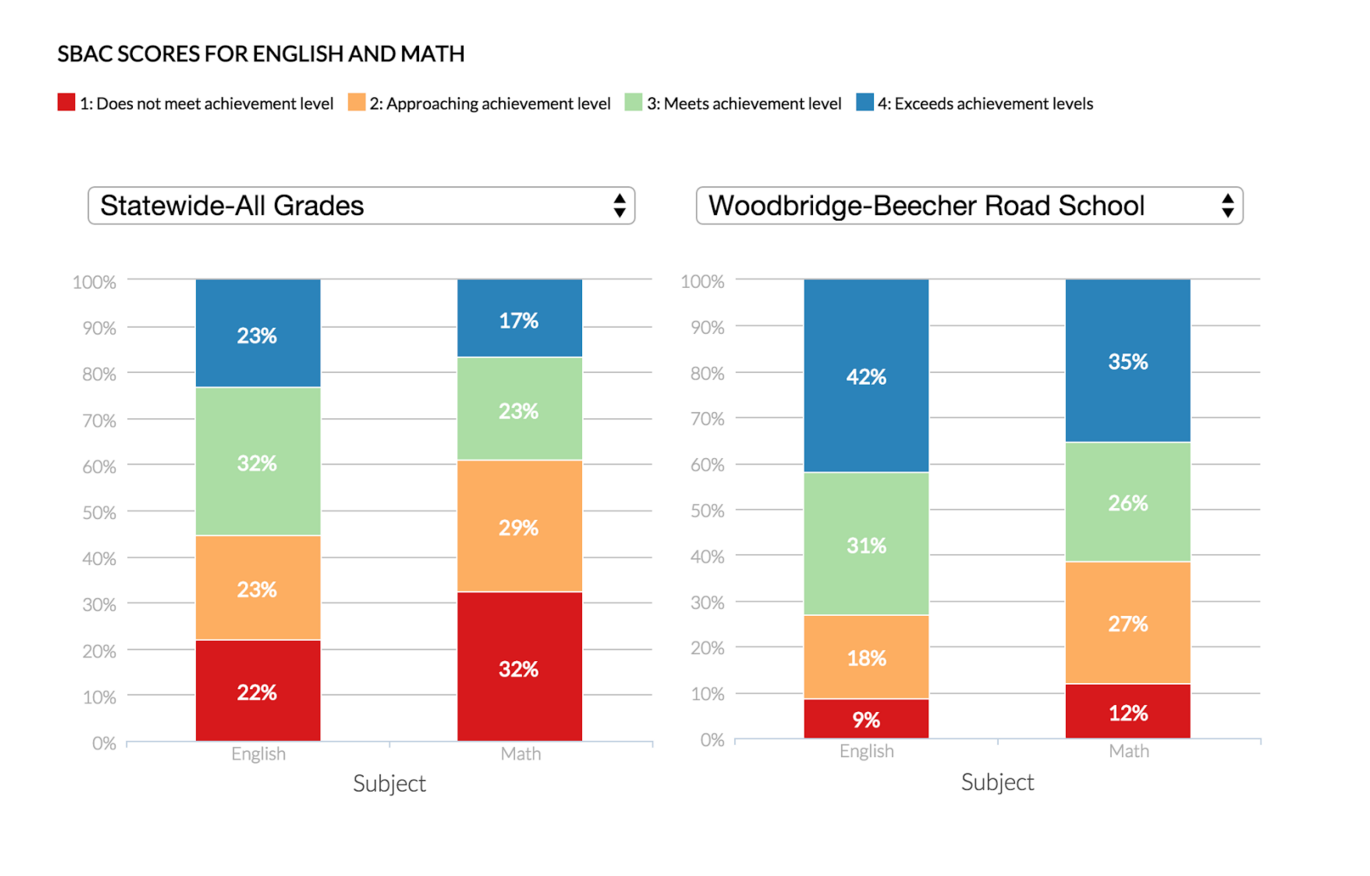
In terms of school performance, the traditional Woodbridge public schools far outperform the state average in terms of testing scores as well as high school graduation rates [8].

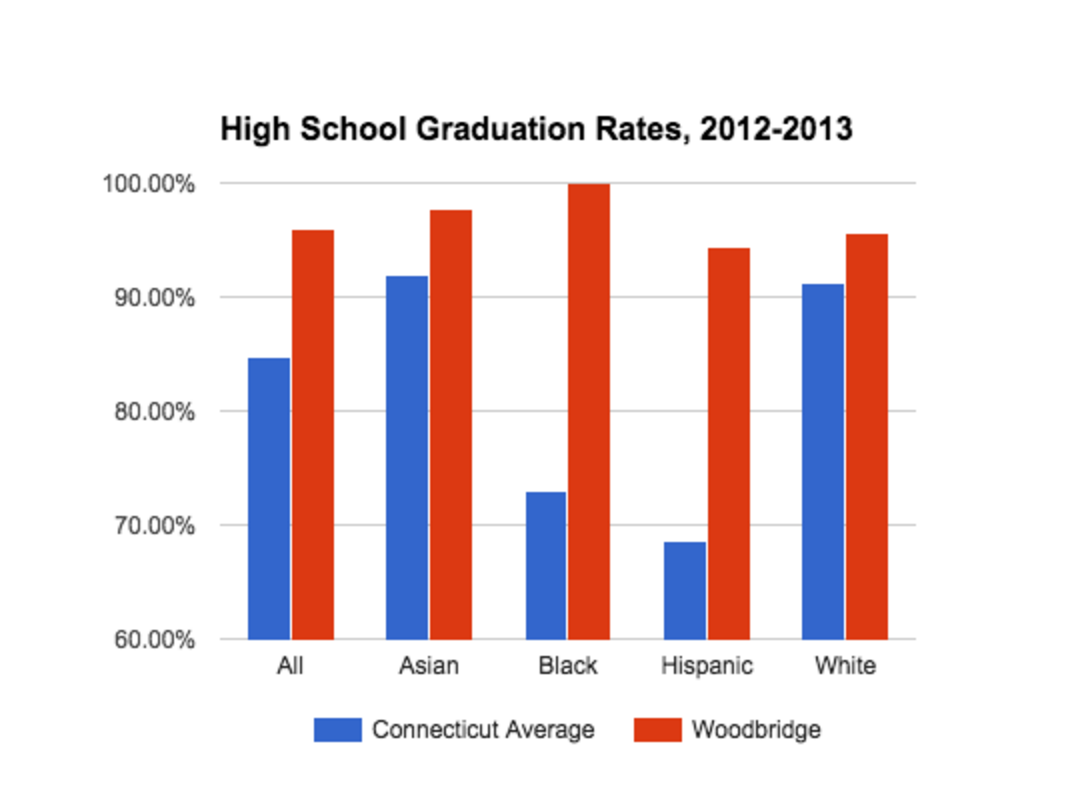
Another interesting factor is that even minority students have a far higher graduation rate than the state averages as well as achieving a far closer graduation rate to white students than one would normally predict given usual patterns of educational inequity [9].
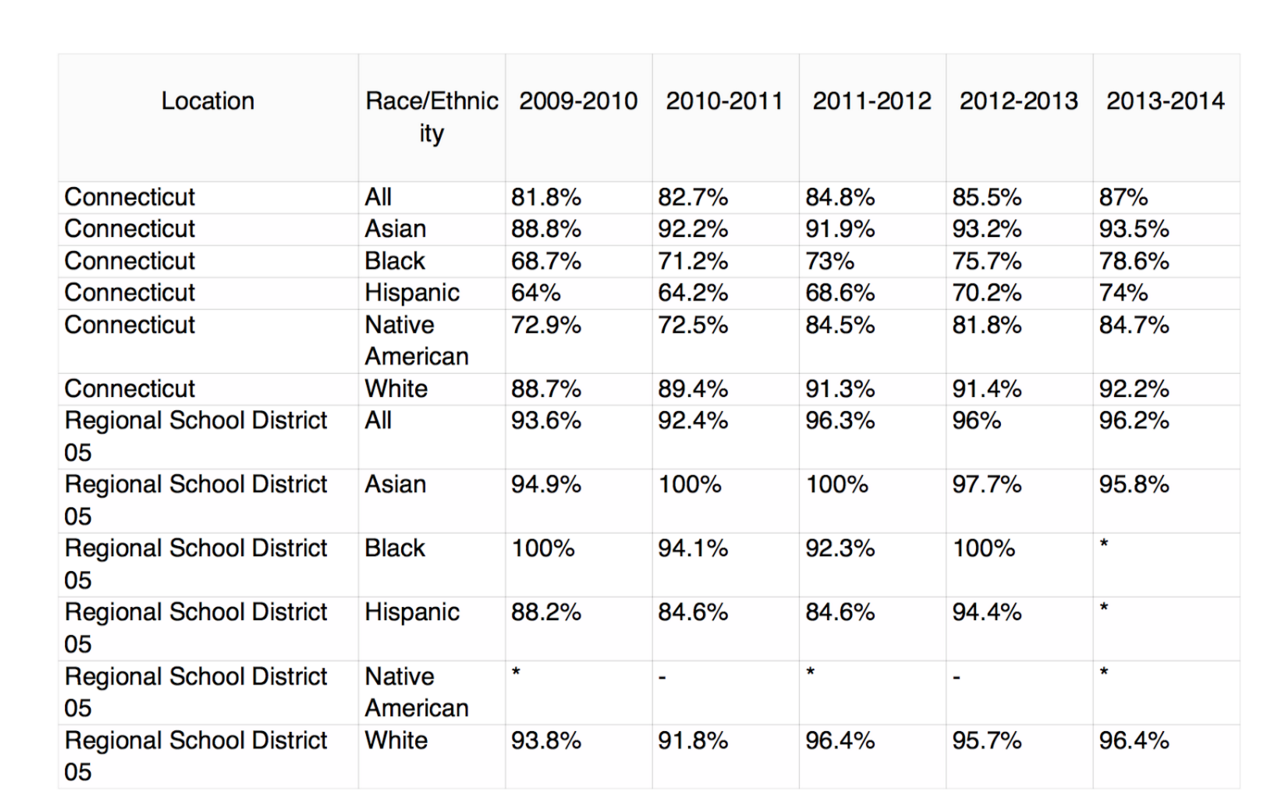
As seen above, however, certain data is missing concerning minority students in years where their absolute numbers fall below 20. This is indicative of a potentially serious issue where minority students, excluding Asian students, have such low numbers as to feel uncomfortable in a population with few ethnically similar students. Notably, the broken down testing data also indicates that there are fewer than 20 English Language Learning students, meaning that it is likely that the high percentage foreign born residents in Woodbridge are English speaking, avoiding certain barriers associated with recent immigrant populations [10].
Information regarding the high school testing data is notably excluded because of a drop in participation rates to 89% from 98% [11]. In combination with the expressed concern of the principal the year that students opting had impacted averages [12], the break from the trend of far exceeding state averages, and the fact that the tests fell at around the same time as SAT and AP tests, there is reason to believe that this scores are not representative of actual school quality. Compared to New Haven suburbs of similar average incomes, the Amity High School is perceived as better, ranking 10th in the state by Niche compared to Madison’s 14th and ranking 18th in the state by US News and World report compared to Madison’s 31st [13]. Additionally, US News and World Report indicates a 51% participation rate in AP exams and a 91% passing rate.
Overall, by most metrics, Woodbridge schools excel academically. From test scores and graduation rates to rankings using a variety of metrics, the school consistently meets high standards, even when compared to other high-income districts around New Haven. However, despite these advantages, Woodbridge does not maintain a very high percentage or quantity of minority students; also, given the town demographics and the fact that only 5% of students meet the qualification for free and reduced lunch,it seems likely that there is a very high number of students of a higher socioeconomic status [14]; consequently, those valuing various forms of diversity would likely see Woodbridge as undesirable.
Housing Stock and Value
In April 2015, the Hartford Courant proclaimed Woodbridge a town not far from the city which embodies a rural charm [15]. While the town contains eight farms, one of which is community run, Woodbridge’s first selectman exulted the town’s booming business district–entrusting neighboring town, Bethany, with distinction of being rural. The 19.19 sq. miles of Woodbridge township is home to 8,925 residents. Woodbridge is New Haven’s least densely populated suburb.
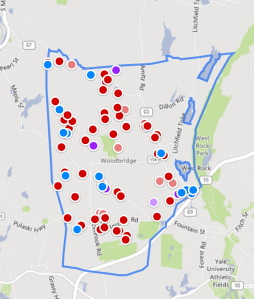
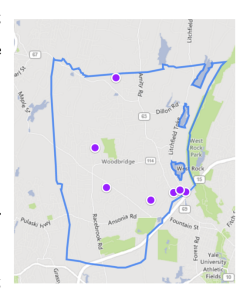
90.6% of Woodbridge residents own homes. The median home value, $468,000, is highest of all New Haven suburbs. The median rental value is $1,449, not the highest of all the suburbs. Someone currently looking to settle down in Woodbridge would find 62 homes for sale and 7 homes available for rent through Zillow.com. The most expensive home being sold is a $1.9 million, 5.31 acre plot of land with a house on it [16]. The value of the home, according to the listing, is primarily that high because of the value of the land. The next expensive home is a 5 bed, 7.5 bath, and 8, 171 sq. ft. estate set on six acres of manicured lawns. It is on sale for $1.2 million [17]. The cheapest home is a 2 bed, one bath, 992 sq. ft. home which resides on a 0.34 acre lot. It runs for $169,000 [18]. Most of the homes for sale contained three beds or more. There are few options for rentals in the town. Zillow.com listed 7 and the majority of these rentals could be found in the lower tract, closer to the city of New Haven. The cheapest rental was $1,050 for a 2 bed and 1 bath apartment [19].This rental hugs the tract boundary on the New Haven side (see Fig. 8).
Reputation
Of the 6 mentions in the New Haven Register over the last month, 5 stories were human interest stories discussing businesses or people in or from Woodbridge [20]. The last is a story discuss a recent series of car “break-ins” were possessions were taken from parked cars [21]. However, the most salient detail in the article is that the several people mentioned that had reported thefts left their cars unlocked. It likely indicates a sense of safety and lack of crime for leaving cares unlocked to be a commonplace practice.
According to a website that examines crime statics, Woodbridge is rated as “low” for level of crime [22].
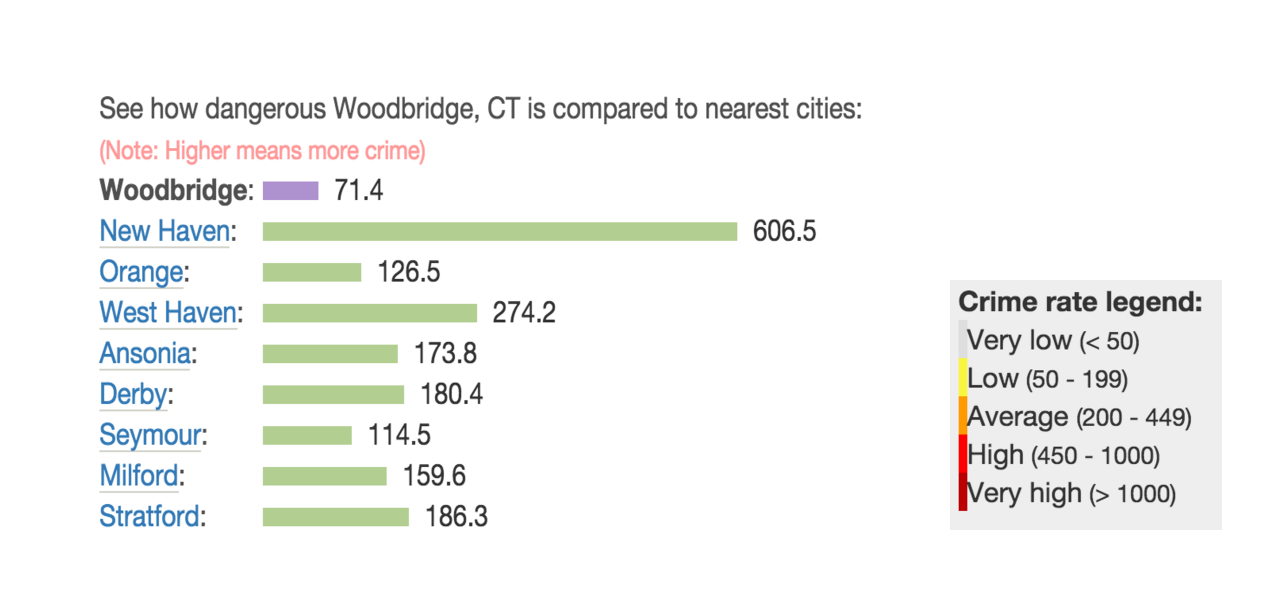
As shown above, crime in Woodbridge is relatively low compared to other towns in the area. Though not listed above, Madison does fall slightly below Woodbridge with a rating of 33.9. However, overall it is quite clear that in both perception and reality, Woodbridge is a relatively safe town.
Conclusion
Overall, the question of desirability rests in the idea of for what one is actually searching. There are certain aspects about Woodbridge such as high performing schools, high property values, and a very high average household income that may make it appear a very attractive suburb of New Haven to potential residents. However, other metrics such as diversity and the small town demographics and atmosphere can be definite drawbacks. It is very unlikely that low income families or students would feel particularly welcomed in the Woodbridge environment. Instead, it caters to upper-middle class and upper class white and Asian ethnic groups. African Americans and Hispanic residents may experience many of the typical prejudices and obstacles of entering these communities, even if their socio-economic status matches that of the other residents. Changes in the town demographics may indicate that some aspects of its current homogeneity will not always be the case as the town increasingly diversifies ethnically—though there is little evidence of socio-economic diversification over time. However, for the moment, it appears desirable only for those that fit the qualities of a “typical” resident.
[1] “Woodbridge, town, New Haven County, Connecticut.” Census.gov Quick Facts.
[2] Ibid.
[3] School sizes from “A complete list of the statewide, district and school scores: Setting the Baseline.” Connecticut State Department of Education, 2015.
[4] “New Haven Interdistrict Magnet Schools.” New Haven Public Schools of Choice, 2016.
[5] “Elementary/Secondary Information System” National Center for Education
[6] Ibid.
[7] Ibid.
[8] Graduation rates and graphic from “4-Year Cohort High School Graduation Rate.” Connecticut Data Collaboration, 2014.
School Testing data from “A complete list of the statewide, district and school scores: Setting the Baseline.” Connecticut State Department of Education, 2015.
Testing Graphic from “Five things the SBAC Scores Show Us.” TrenD Ct; August 21, 2015.
[9] Graduation rates and graphic from “4-Year Cohort High School Graduation Rate.” Connecticut Data Collaboration, 2014.
[10] “A complete list of the statewide, district and school scores: Setting the Baseline.” Connecticut State Department of Education, 2015.
[11]Ibid.
[12] “Amity High School PTSO Meeting Minutes April 16, 2015.” Amity Regional District 5, 2015.
[13] “2016 Best Public High Schools in Connecticut.” Niche, 2016.
“Connecticut High Schools.” US News and World Report, 2015.
[14] “A complete list of the statewide, district and school scores: Setting the Baseline.” Connecticut State Department of Education, 2015.
[15] “Woodbridge and Bethany: Rural Charm Not Far From the City.” Hartford Courant, 2015.
[16] “275 Old Amity Rd, Woodbridge, CT 06525.” Zillow.com
[17] “37 Hunting Hill Rd, Woodbridge, CT 06525.” Zillow.com
[18] “7 West St, Woodbridge, CT 06525.” Zillow.com
[19] “Undisclosed Address, Woodbridge, CT 06525.” Zillow.com
[20] “Search Results for Woodbridge.” New Haven Register, 2016.
[21] “Woodbridge police investigate rash of weekend car break-ins” New Haven Register. February 16, 2016.
[22] “Crime Rate in Woodbridge.” City-Data.com, 2016.